Net Volume Indicator
A security's uptick volume minus its downtick volume over a specified time period. The net volume of a stock aggregates the total positive and negative movements of the security over this period. When the total upward movement is greater than the total downward movement over this period, the stock has a positive net volume.
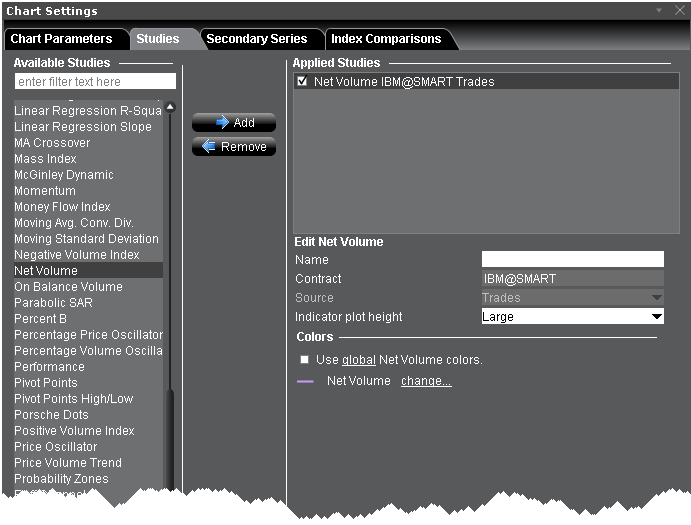
To apply a Net Volume Indicator
- From within a chart, from the Edit menu select Studies.
- Choose Net Volume and click Add to add the study to the Applied Studies group.
- Complete parameters as necessary.
Once the study is defined, you can elect to uncheck/check to remove and add the study to your chart.
© 2016 Interactive Brokers - TWS用户指南