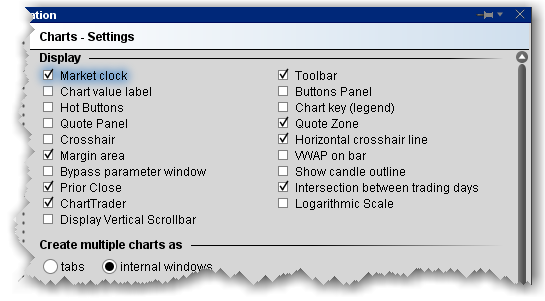
Define global default display settings for charts.
Name - Description
Name - Description
Market clock - if checked, displays the time in the top title bar.
Toolbar - check to display theChartstoolbar.
Chart value label - if checked, the Price, Volume and other axis labels are displayed.
ButtonsPanel - check to display configurable ChartTrader buttons.
Hot Buttons - check to display the floating Buy/Sell/Alert set of hot buttons that you use to create orders. Hot buttons can be armed to transmit instantaneously.
Chart key (legend)- if checked, displays a key to the color, type of chart and asset charted along the bottom of the chart.
Quote panel- if checked, the Quote panel, which shows market data for the contract, displays at the bottom of the chart window.
Quote Zone - check to display the Quote Zone, which floats within the chart along the top.
Crosshair - puts the cursor into crosshair mode and displays the vertical crosshair line.
Horizontal Crosshair Line - when checked, both the vertical and horizontal crosshair lines are displayed on a chart when you are in Crosshair Mode. When unchecked, only the vertical crosshair line displays.
Margin area - check to display a small, left-facing arrow at the bottom of the chart. Drag the margin in to increase the horizontal buffer.
VWAP on bar - check to show the volume- weighted average price on the bar.
Bypass parameter window - check to open charts using specified data without opening the Chart Parameters window.
Show candle outline - check to shows outlines for candlesticks.
Prior close - check to show the prior close price on the chart.
Intersection between trading days - check to show a dotted line as a separator
ChartTrader - Displays the Orders, Log, Trades and Portfolio tabs along the top of the chart. These panels will also open automatically when you create an order.
Logarithmic Scale - Change the increments on the price axis to represent price change by "percentage change"- rather than "dollar-value" change. Using Log Scale, a $5.00 change from 10 to 15 represents a 50% price change, while a $5.00 change from 20 to 25 is a 25% change.
Display Vertical Scrollbar - Adds a vertical scrollbar.
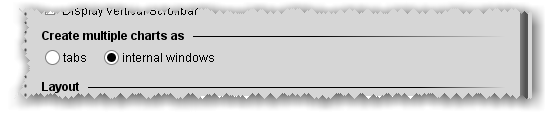
Create multiple charts as
Specify the layout for multiple charts.
Tabs - each charts goes into its own tabbed page.
Internal windows - charts are tiled within the same frame.
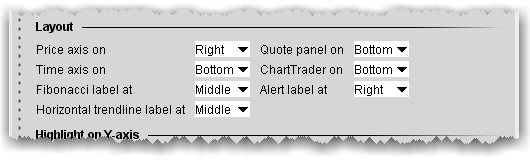
Layout
Set up global default layout options for charts.
Price axis on: Left, Right, or Both
Quote panel on: Top or Bottom
Time axis on: Top, Bottom or Both
ChartTrader on: Top or Bottom
Fibonacci label at: Left, Middle or Right side of the top red Alerts bar.
Alert label at: Left, Middle or Right side of the top red Alerts bar.
Horizontal trendline label at: Left, Middle, Right or None
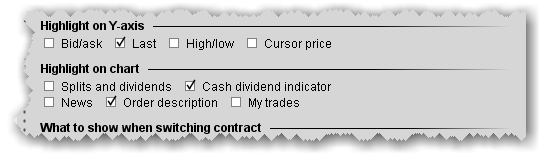
Highlight on ...
Define which items you want highlighted on the Y (price) axis and on the chart.
Check the prices to highlight along the price axis. “Cursor price” is the price over which your cursor is currently hovering within the chart.
Check the events to highlight in the chart itself. Holding your cursor over any of the highlighted events will display a text description of the event.
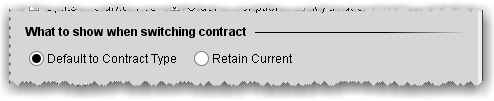
What to show when switching contract
When adding a new chart, choose to either use the default “What to show” selection (i.e. Trades for stocks, Midpoint for Forex) or keep the selection from the current chart.
Trendlines
Set trendline characteristics for charts.
Field
Description
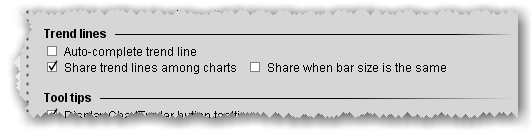
Auto-complete trendline
If checked, you can instruct TWS to complete a freehand trendline. Begin your trendline by clicking and holding the mouse. To use auto-complete, release the mouse key, then click again. TWScompletes the trendline across the chart, following your trajectory.
Share trend line among charts
If checked, a trendline drawn on one chart will appropriately be reflected on other active charts using the same contract.
Share when bar size is the same
Check to share trendlines only when the bar size on charts is the same, e.g. 5 min bar, 4 hour bar, daily bar etc.
This feature is only enabled when Share trend line among charts is checked.
Tooltips
Specify whether to show tooltips on the chart, and how to display.
Field
Description
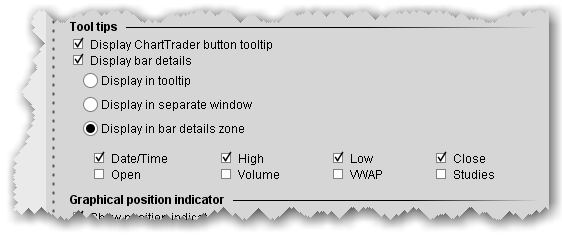
Display ChartTrader button tooltip
Check to see mouse-over tooltips of the buttons on the button panel.
Display bar details
Check to show details for bars in a bar chart. Use the radio buttons to specify where the information will be displayed.
If you select "bar details zone" you can pick the data fields that display.
"tooltip" shows details in the mouse-over information.
"separate window" opens a small pop-up window in the chart each time you mouse over a bar.
"bar details zone" displays information in the bottom right corner. Details change as you mouse over each bar.
Display any of the following fields in the Bar Details Zone: Date/Time, High, Low, Close, Open, Volume, VWAP and Studies.
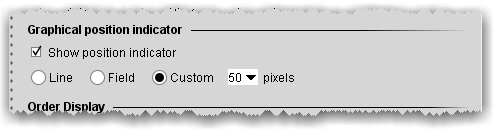
Graphical position indicator
Use colors to show the current position in the chart.
Check to indicate your current position using lines or color in the chart
Line - draws a line at the price point of the position.
Field - shades the chart from the position up (long position) or down (short position).
Custom - define the height of the shaded field.
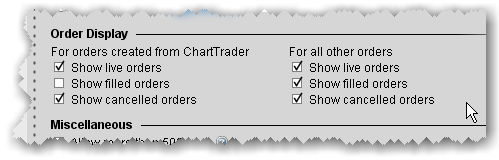
Order Display
Define display features for orders shown in your chart. Set for both ChartTrader orders (orders submitted from within the chart) and for all other orders (including orders submitted from any tool or window other than ChartTrader).
Field
Description
Show live orders
Display working orders on the chart.
Show filled orders
Display filled orders on the chart.
Show cancelled orders
Display cancelled orders on the chart.
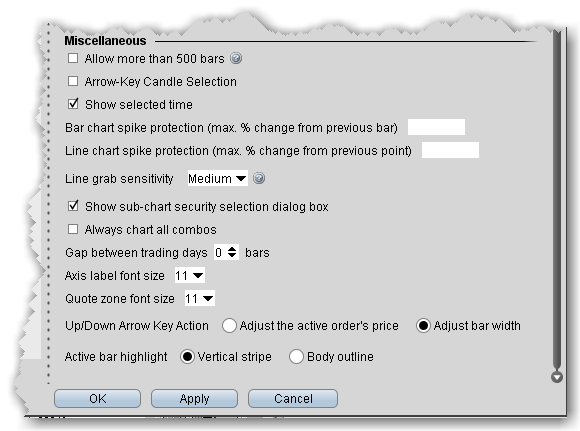
Miscellaneous
Define other miscellaneous chart features.
Field
Description
Allow more than 500 bars
Enables smaller bar size for the same time periods. Note that some bars may be too small to read.
Arrow-Key Candle Selection
Moves the control for moving from bar to bar from the mouse cursor to the keyboard arrow keys.
Show selected time
When checked, the specific time displays in highlighted yellow along the bottom axis of the chart as you move the cursor.
Bar chart spike protection (max. % change from previous bar)
If you want to apply spike protection, enter a percentage value. If any bar exceeds this percentage relative to the previous bar, it is automatically eliminated from the chart.
Line chart spike protection (max. % change from previous point)
If you want to apply spike protection, enter a percentage value. If any point exceeds this percentage relative to the previous point, it is automatically eliminated from the chart.
Line grab sensitivity
The higher the sensitivity, the more precise you will need to be to grab and move lines. Higher sensitivity makes it easier to draw trendlines close together.
Show sub-chart security selection box
When checked, a box asking if you want the sub-chart to use the same security as the selected chart is displayed when you elect to Add New Chart.
Always chart all combos
Check to chart combos. If you leave unchecked, you will be asked on an individual basis. Charting combos uses more system resources than charting individual contracts.
Gap between trading days
Define the number of missing bars (up to 9) allowed between trading days.
Axis label font size
Select a font size to be used along the price and time axes.
Quote zone font size
Select a font size to be used in the chart’s Quote Zone.