|
Field
|
Description
|
|
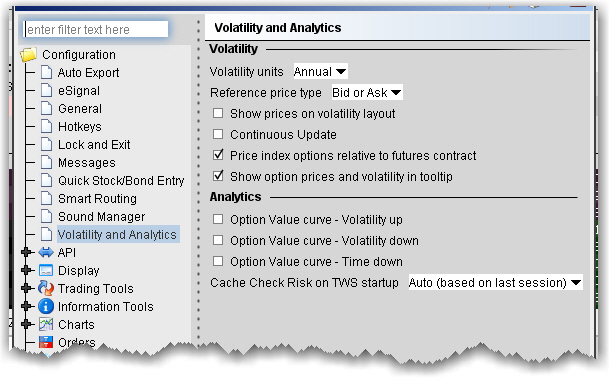
Volatility units
|
Choose either Annual or Daily.
|
|
Reference price type
|
Choose Bid or Ask to use the NBB (bid) when buying a call or selling a put and the NBO (ask) when selling a call or buying a put. Choose Average to use the average of the best Bid and Ask. This price is also used to compute the limit price sent to an exchange (whether or not Continuous Update is selected), and for stock range price monitoring.
|
|
Show prices on volatility layout
|
When checked, the volatility page displays prices rather than volatility, with volatility in parentheses. If unchecked (which is the default) values in the Price columns will be the volatility.
|
|
Continuous Update
|
When checked, the checkbox in the Continuous Update field is automatically checked and enabled. You can de-select Continuous Update on a per order basis.The Continuous Update feature monitors the underlying price and will update the price of the order if the price of the underlying instrument changes significantly. Note that you can only use Continuous Update for three active orders at a time.
|
|
Price index options relative to futures contract
|
When checked, you can price smart-routed Volatility index option orders off a selected futures price from the Reference Contract field on the order line.
|
|
Show option prices and volatility in tooltip
|
Check to display the option price or volatility as a mouse tip when you hover over the value in an order line.
|
|
Field
|
Description
|
|
Option Value Curve - Volatility up
|
Shows a different scenario on the Option Analytics plot. Uses a blue line to show a raise in the implied volatility by 15% in relative change* using a blue line.
|
|
Option Value Curve - Volatility down
|
Shows a different scenario on the Option Analytics plot. Uses a red line to show a reduction in the implied volatility by 15% in relative change*
|
|
Option Value Curve - Time down
|
Decreases the time to expiration by one calendar day.
|
|
Cache Check Risk on TWs startup
|
Choose to Always cache, Never cache, or make the choice based on your last selection (Auto).
|
*For an example of a relative percent change, if the current implied volatility of an option is 10%, a 15% relative change would result in an implied volatility of 11.5%, calculated as follows:
10% * (1 + 0.15) = 11.5%.