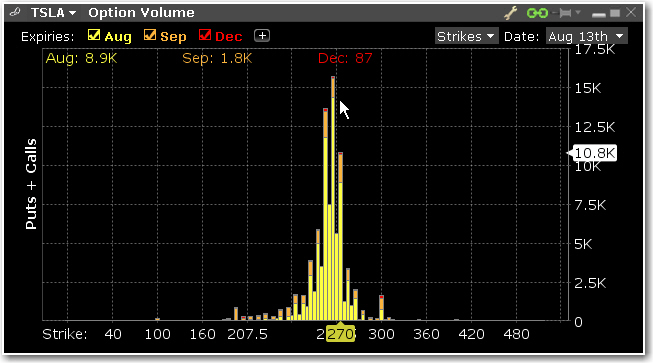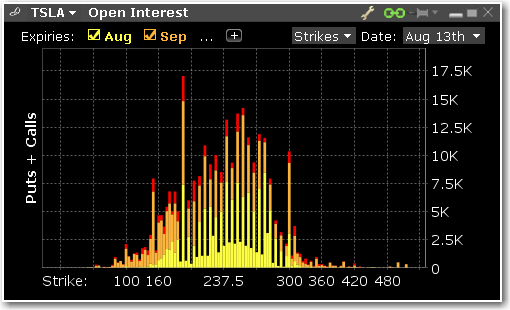
Open Interest and Option Volume
view current or historic open interest for available contract months and strikes. Choose any available expiry and view the combined put and call reading of open interest. The plot can be restricted to specific strikes or will default to open interest across all strikes. Open interest measures investor enthusiasm for a particular stock and also identifies strikes where most or least liquidity might be available. Note also that in the upper right corner there is a calendar drop-down menu that allows the user to view open interest on chosen months or strikes from prior dates. Just pick the time period and select that date.
To view Open Interest/Option Volume
Use the Configure Wrench icon to change modes between Open Interest and Option Volume. The Chart allows the user to determine whether to see volume or open interest for Puts and Calls combined in one chart (Puts + Calls) or broken out into bull and bear contracts in two charts (Puts & Calls). Use the calendar dropdown to review activity or positioning from any prior calendar date.