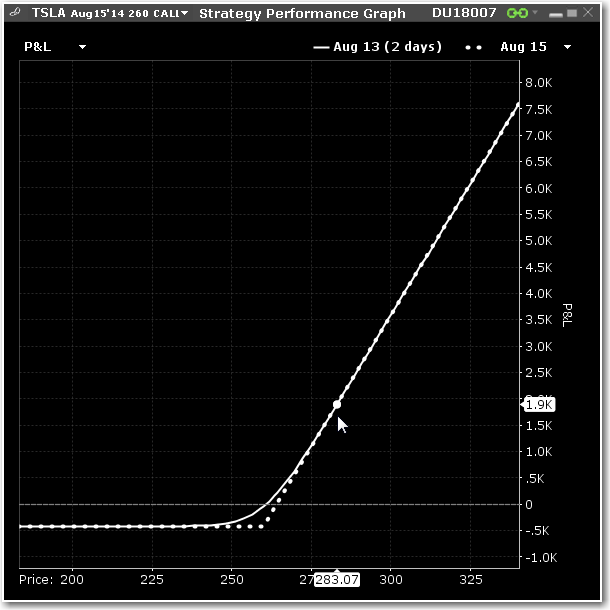
Displays the P&L (or any of the Greeks) as a function of the underlying price. The graph is displayed as part of the Performance Profile, and can also be opened as its own window.
To open the Strategy Performance Graph
From Mosaic - From the New Window drop down list select Option Analysis and then Strategy Performance Graph.
From Classic TWS - From the Analytical Tools menu, select Option Analysis and then Strategy Performance Graph.