Select this report to view values for the symmetric data slicers in the P&L Plot. By default the slicers are spaced at +/- 3%, 6%, 9%, 12% and 15%.
If you have the crosshair activated in the P&L plot using the right-click menu, when you hold your mouse over a line in the plot its value is displayed.
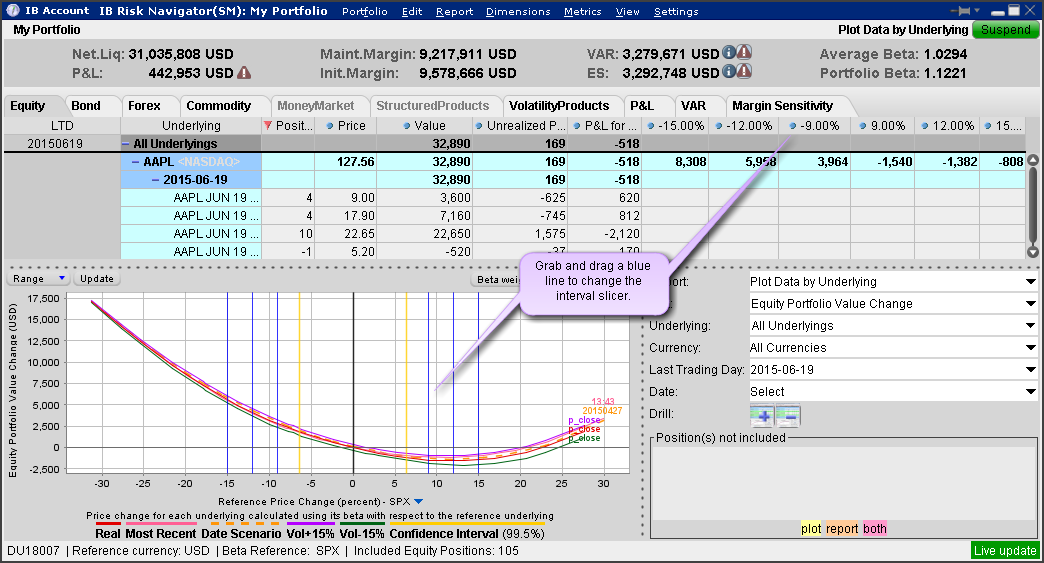
To open the Plot Data by Underlying report
1. Open the Risk Navigator
- From Mosaic - Use the New Window drop down and select Risk Navigator from the Advanced Trading Tools category.
- From Classic TWS - Use the Analytical Tools menu and select Risk Navigator from the Portfolio category.
2. From the Report drop down list, select Plot Data by Underlying.

To change the interval between plot slicers
1. From within the plot, drag any of the blue slicer lines in an out to change the interval. Note that the corresponding negative/positive line will also adjust.
2. Using the menu, from the Metrics menu select Plot data columns and then select Settings.