The Portfolio Relative P&L graph illustrates how the total value of your portfolio for a specific asset class (or a subset of your portfolio) will change, based on a percent change in the price(s) of the underlying(s). Available settings may change based on the asset class displayed.
The image above shows the portfolio relative P&L for an equity portfolio, based on the value All Underlyings selected from the Underlying list in the Report Selector.
Note that for leveraged ETFs, the Risk Navigator moves them by their target performance ratio in the aggregated P&L graph. For example, for an index and its triple inverse ETF, to the +10% P&L it adds the index P&L at 10% to the ETF P&L at -30%. When either one is plotted individually, it shows their own P&L, but it shows the index on a +/-30% range and the ETF on a +/-90% range. Risk Navigator
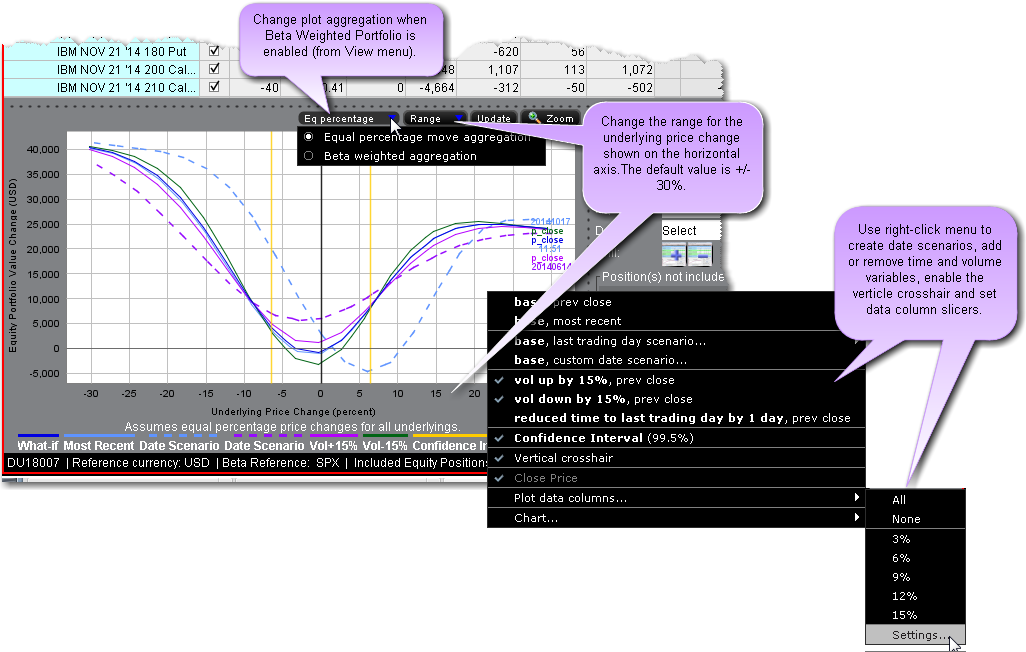
Beta analysis in IB Risk Navigator allows the investor to view the P&L plot differently. In its default format "Equal Percentage," the P&L plot assumes a same percentage move for all underlying portfolio pieces. When Beta Weighted Aggregation is selected, the underlying price scenario includes beta weighted price changes. Beta explains the performance of a stock over and above that associated only with the performance of the market itself.
The Confidence Interval, shown within the yellow vertical lines, illustrates the worst-case loss over a one-day period with a default 99.5% confidence level. Use the Confidence subcommand on the Settings menu to toggle between 95%, 99% and 99.5% confidence levels. Turn the Confidence Level brackets on or off using the Confidence Interval command on the right-click menu.
Use the Vol-up by 15%*, Vol-down by 15%* and reduced time to expiry by 1 day checkboxes in the right-click menu to view the plot under different scenarios to help you visualize the volatility and time risk in your option positions. While you can elect to display the base P&L using both the previous day’s closing price and the most recent dynamic price, the volatility and time variables are always based on the previous close.
*The Vol Up and Vol Down commands increase/decrease projected volatility in relative percent change. Relative percent change is calculated by multiplying the current implied volatility by 15%, and adding/subtracting this value to/from the current implied volatility. For example, if the current implied volatility of an option is 10%, a 15% relative increase would result in an implied volatility of 11.5%, calculated as follows: 10 + (10 * 0.15) = 11.5% . If the current implied volatility of an option is 42.45%, a 15% relative decrease would result in an implied volatility of 36.082%, calculated as follows: 42.45 - (42.45 * 0.15) = 36.082%.
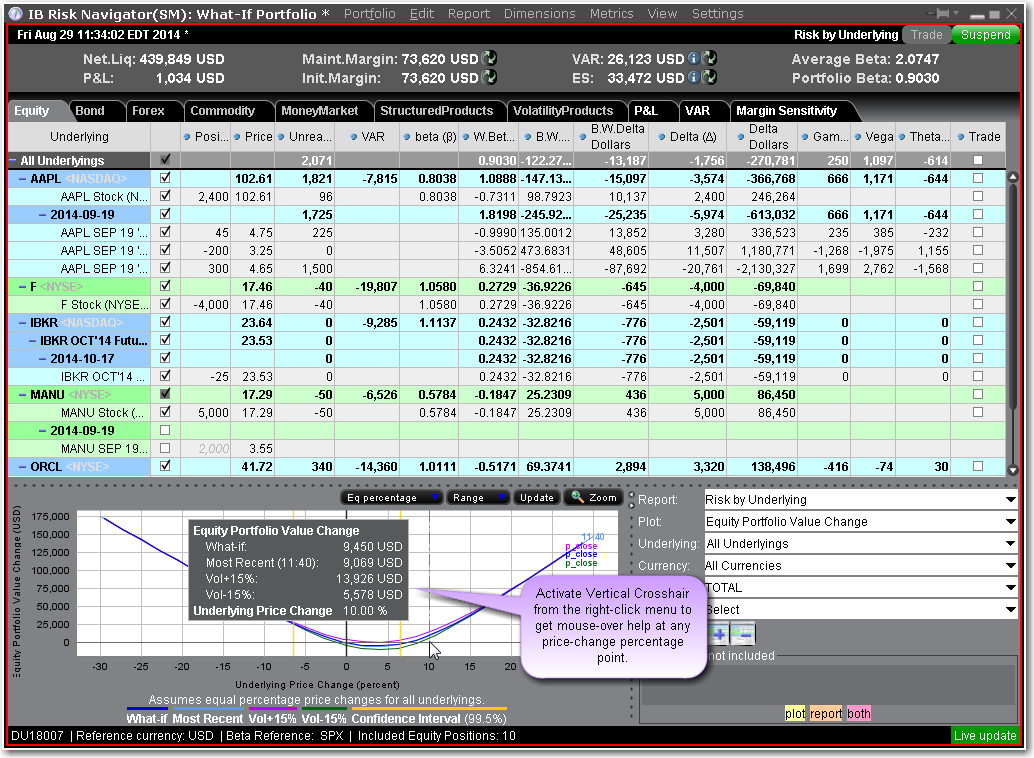
When the Vertical Crosshair is activated on the P&L graph using the right-click menu, you will get mouse-over help at any price-change percentage point.
Note: For Bonds, the P&L plot is based on the interest rate change.
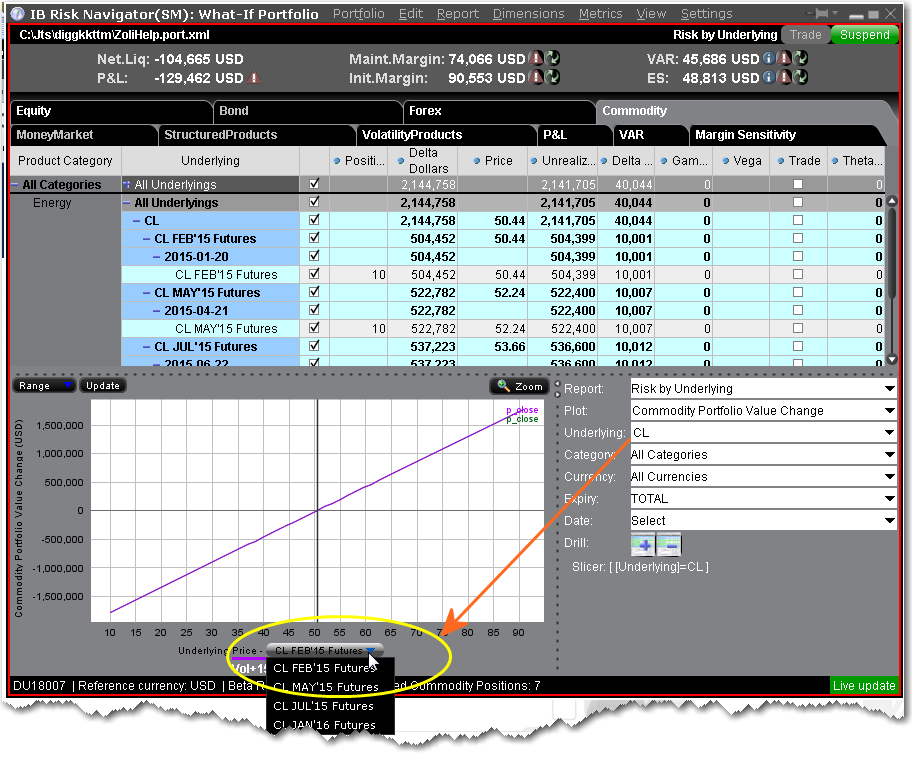
In cases where the index price is invalid for futures/futures options, the graph provides a drop-down selector with available expirations to use for the reference price. Ensure that the "Underlying" field in the report selector has only one contract selected.