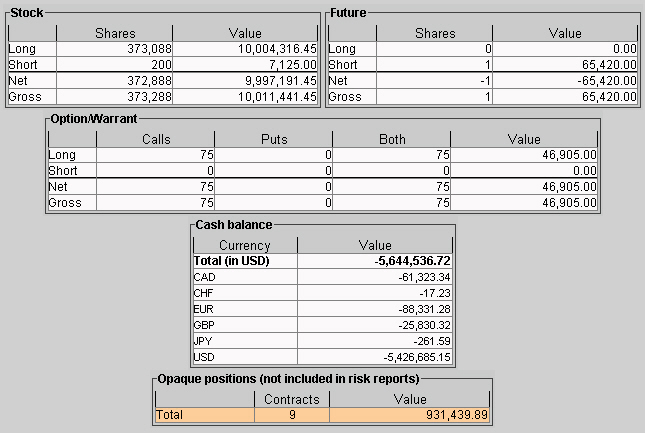
The Portfolio Statistics report shows two summary tables: one for all Stock and Futures positions, and one for all Options positions.
The Stock and Future summaries shows all long positions, all short positions, the net and gross units, and their corresponding total value.
The Option/Warrant summary shows all long calls, long puts, the sum of both calls and puts, and the total value; all short calls, short puts, the sum of both calls and puts, and the total value; the net units for calls, puts, the sum of both and the total net value; and gross units for calls, puts the sum of both, and the corresponding net value.
The Cash balance summary shows you total in base, and all cash totals for currencies in your portfolio.
The Opaque Positions list displays positions for which risk cannot be calculated. While these positions are not included in any risk reports, the market value is included in the Portfolio Value version of the P&L graph.