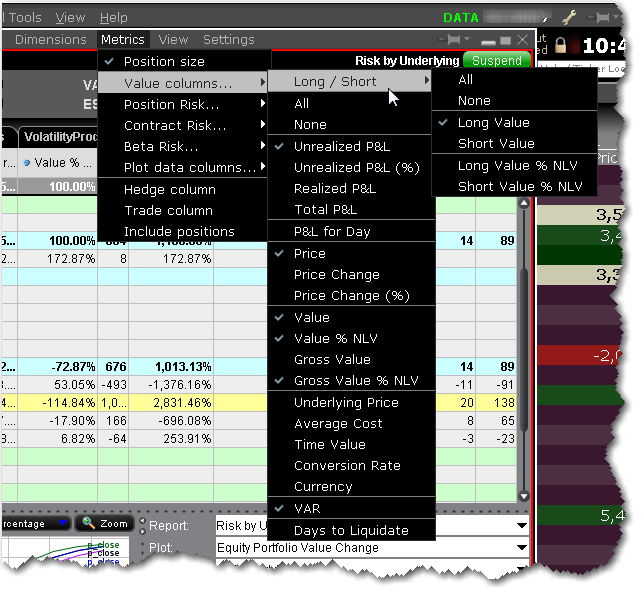
The Risk Navigator Metrics menu is context-sensitive, and allows you to select applicable metrics for each report.
Note: Not all menu commands are available for all reports. For example, the Portfolio Analysis columns are only available in the P&L Summary.
|
Metrics |
Description |
|
Size columns... |
|
|
Select Position size to display your (signed) position in the contract. A short position is depicted by a "-" minus sign. Choose "None" to remove the Position field from your report. |
|
|
Value columns... |
|
| Long/Short | These columns provide aggregated values for all long and all short positions. |
| All | Selects all available value columns to include in the report. |
| None | De-selects all columns. |
|
Unrealized P&L (%) |
(Market value of positions) - (average cost) (Market value of positions) - (average cost) shown as a percentage. |
| Realized P&L |
(Market value of positions since close of period*) - (average cost for these positions). *Cut-off times for determining realized P&L for transactions are as follows: • 20:30 ET for securities • Two periods for futures: 17:30 ET and 7:10 ET |
|
The "unrealized" Average Cost P&L is shown in total, per underlying, and for each position. |
|
| P&L for Day |
(current price - prior day's closing price) x (total number of outstanding shares) + (New Position calculation for all new positions) |
|
Price |
The current market price of one unit of the contract. |
| Price Change | The difference between the last price, and the closing price on the previous trading day. |
| Price Change % | The percentage difference between the last price, and the closing price on the previous trading day. |
| Value |
Current market value of the position. Position x Multiplier x Price |
| Value % NLV |
The ratio of the current value to the total net liquidity of the portfolio. For CFDS and futures: The ratio of the Daily P&L to the total net liquidity of the portfolio. |
| Gross Value | The current gross market value of the position. |
| Gross Value % NLV/GMV | The current gross market value of the position as a percentage of the total New Liquidation Value (or Gross Market Value) of the portfolio. |
| Underlying Price | The price of the underlying (in cases where position is a derivative). |
| Average Cost | The average price you paid (cost) per unit. |
|
Time Value |
The (price) x (position). |
|
Displays the rate used to convert non-base positions into the base currency. |
|
| Currency | The currency of the position. |
|
Value at Risk (VAR) represents the minimum expected loss under normal market conditions over a specific time horizon, and based on the percent probability as defined by the confidence level. This is a theoretical value and does not represent the potential worst-case loss scenario. Note: In cases where the VAR cannot be calculated, the notation "N/A" is displayed on a violet background. |
|
| Portfolio Analysis columns... | |
| Mark-to-Market P&L Month-to-Date | Shows the profit or loss recognized in the current month for both open and closed positions. |
| Mark-to-Market P&L Month-to-Date (%) | The percent that the position's mark-to-market P&L for the current month-to-date accounts for, relative to the portfolio's total. |
| Mark-to-Market P&L Year-to-Date | Shows the profit or loss recognized in the current year for both open and closed positions. |
| Mark-to-Market P&L Year-to-Date (%) | The percent that the position's mark-to-market P&L for the current year-to-date accounts for, relative to the portfolio's total. |
| Realized P&L Month-to-Date | Realized month-to-date P&L from the previous business day + realized P&L from the current day. |
| Realized P&L Month-to-Date (%) | The percentage of the position's realized P&L month-to-date to the portfolio's total month-to-date P&L. |
| Realized P&L Year-to-Date | Realized year-to-date P&L from the previous business day + realized P&L from the current day. |
| Realized P&L Year-to-Date (%) | The percentage of the position's realized P&L year-to-date to the portfolio's total year-to-date P&L. |
| Unrealized P&L Month-to-Date | The change in unrealized P&L in the current month. |
| Unrealized P&L Month-to-Date (%) | The percentage of the change of the position's unrealized month-to-date P&L to the portfolio's total change in unrealized month-to-date P&L. |
| Unrealized P&L Year-to-Date | The change in unrealized P&L in the current year. |
| Unrealized P&L Year-to-Date (%) | The percentage of the change of the position's unrealized year-to-date P&L to the portfolio's total change in unrealized year-to-date P&L. |
| Long/Short | These columns provide aggregated values for all long and all short positions. |
| All | Selects all available value columns to include in the report. |
| None | De-selects all columns. |
|
Delta |
This position delta captures both the direction and the magnitude of the portfolio's sensitivity to an underlying by representing the degree and direction of change in the option price, based on a change in the price of the underlying. We use a capital "D" to differentiate the IB Risk Navigator position Delta from the contract delta. Position Delta is calculated as (delta * position). |
| Delta Dollars |
Delta Dollars is calculated using the formula: delta x underlying price. |
| Delta Dollars % NLV/GMV | The ratio of the current exposure to the total Net Liquidity Value (or Gross Position Value) of the portfolio. |
|
This column is derived from raw position delta. For each futures position or futures option position with this future as direct underlying, futures delta = (delta / exp(r*T)) / futureMultiplier, where futureMultiplier is the contract multiplier of future, exp(r*T) is the scaling factor that we currently apply to raw delta; dividing by it yields the original raw delta. |
|
|
Gamma helps you assess directional risk by defining the speed at which the option's directional changes will occur, i.e. the rate of change of delta. We use a capital "G" to differentiate the IB Risk Navigator "position Gamma" calculated as (gamma * position) from the contract gamma calculation. |
|
| Gamma Dollars |
Gamma Dollars is calculated using the formula: 0.5 x Gamma x (Underlying Price x 1%)2 |
|
Vega represents the portfolio's sensitivity to changes in implied volatility of the underlyings, and shows the change in the price of an option relative to a change in the implied volatility of the underlying. Generally long option positions benefit from rising (and suffer from declining) implied volatilities, while short option positions experience the opposite - they benefit from declining (and suffer from rising) implied volatilities. We use a capital "V" to differentiate the IB Risk Navigator "position Vega" calculated as (vega * position) from the contract vega calculation. |
|
|
Theta represents the portfolio's sensitivity to the passage of time by indicating the rate at which the market value of your portfolio will change with time. This metric calculation is based on the assumption that all other variables remain unchanged, including the underlying price, implied volatility and interest rate. We use a capital "T" to differentiate the IB Risk Navigator "position Theta" calculated as (theta * position) from the contract theta calculation. |
|
| Beta Risk columns | |
| Contract Risk columns... | |
| All |
The "unrealized" Average Cost P&L is shown in total, per underlying, and for each position. |
| None |
The current market price of one unit of the contract. |
| Delta | Delta captures both the direction and the magnitude of the portfolio's sensitivity to an underlying by representing the degree and direction of change in the option price, based on a change in the price of the underlying. |
| Gamma | Gamma helps you assess directional risk by defining the speed at which the option's directional changes will occur, i.e. the rate of change of delta. |
| Vega | Vega represents the portfolio's sensitivity to changes in implied volatility of the underlyings, and shows the change in the price of an option relative to a change in the implied volatility of the underlying. Generally long option positions benefit from rising (and suffer from declining) implied volatilities, while short option positions experience the opposite - they benefit from declining (and suffer from rising) implied volatilities. |
| Theta | Theta represents the portfolio's sensitivity to the passage of time by indicating the rate at which the market value of your portfolio will change with time. This metric calculation is based on the assumption that all other variables remain unchanged, including the underlying price, implied volatility and interest rate. |
| Implied Volatility | The implied volatility on an option. |
| Implied Volatility Change | The absolute change in implied volatility between the current value and the value calculated using yesterday's closing price. |
| Implied Volatility Change (%) | The change in implied volatility between the current value and the value calculated using yesterday's closing price, as a percentage. |
| Historical Volatility | The last available historical volatility. |
| Historical Volatility Change | The difference between the historical volatility as of yesterday's close and the current historical volatility. |
| Historical Volatility Change (%) | The difference between the historical volatility as of yesterday's close and the current historical volatility, as a percentage. |
|
Hedge |
Adds a new column with checkbox, which allows you to select multiple subportfolios by underlying (a subportfolio includes all of your positions in an underlying and its derivatives) and create a basket of hedge orders to offset the deltas of each subportfolio. |
| Plot data columns.. | |
| All | Adds all data slicers below to the P&L Plot. |
| None | Removes all data slicers from the P&L Plot. |
| 3% | Add or remove just this pair of data lines (+3%/-3%) |
| 6% | Add or remove just this pair of data lines (+6%/-6%) |
| 9% | Add or remove just this pair of data lines (+9%/-9%) |
| 12% | Add or remove just this pair of data lines (+12%/-12%) |
| 15% | Add or remove just this pair of data lines (+15%/-15%) |
| Settings | Click to adjust slicer line values. You can also grab and drag slicer lines within the P&L plot. |
| Hedge Column | Check to create a hedging order for the selected position. Click the "Hedge" button at the top of the portfolio to create the hedging orders in TWS. You need to manually transmit the order(s). |
| Trade Column |
For What-If only: If you want to add a what-if position to your real portfolio, check the "Trade" checkbox to tag the position for order creation. When you click the "Trade" button at the top of the What-if, an order will be created in TWS. The order quantity will reflect the difference between your current position and the what-if quantity so that the result will mimic the what-if position as closely as possible. You need to manually transmit the order(s). |
| Include Positions | For What-If only: indicates that you want the position included in the risk calculations and in the P&L graph computation. |