Volatility products, including derivatives on the widely recognized volatility indexes and funds such as ETFs, may help traders gain exposure to the volatility of several instruments including equity indexes, single stocks and other underlying instruments. Risk Navigator presents volatility in percentage terms, and allows users to choose between annualized and daily volatility.
The volatility indexes, published daily by exchanges, are specific measures of the implied volatility of certain underlying products. Documentation for the computation methodology of these measures can be found on the various exchange websites.
Notable examples of some of these volatility indexes are below, with the equity index, ETF or single stock whose volatility these indexes measure in parentheses:
The indexes are quoted in annual percentage terms, except for a small number of interest-rate related indexes which are quoted in basis point terms. For example, VIX is the annualized percentage volatility of SPX; a VIX of 1 means an SPX volatility of 0.01 or 1%. Consider a VIX call with VIX-delta equal to 0.8. It would appreciate by 0.8 x 1 = 0.8 if VIX were to increase by 1. This is equivalent to saying that the value of the VIX call will rise by 0.8 when the SPX volatility goes up by 1%, and that the VIX call has an SPX-vega of 0.8. (Vega is defined in Risk Navigator as the derivative value change due to a 1% change in the underlying price.)
Generally , a portfolio that has VIX-delta risk can be viewed as having SPX-vega risk. The following formula provides the translation between the delta risk of the volatility index and the vega risk of the underlying it measures. The volatility index-specific scaling factor below captures the quotation convention of each index
Vega(underlying) = Delta(derivative of volatility index) x (volatility index-specific scaling factor) x 0.01
ETFs are designed to provide exposure to some targeted volatility indexes. Unlike a single-volatility index derivative position, these funds are portfolios of volatility index derivative positions with various expiries in different proportions. This creates a directional or inverse exposure to the volatility indexes.
Below are some examples of these ETFs with the targeted volatility indexes for which they provide exposure in parentheses:
The relationship between the prices of these funds and the volatility indexes are entirely statistical in nature due to the fact that composition of these funds could be opaque, tracking errors exist, and fund portfolios are dynamically constructed with periodic rebalancing and rollovers near expiration dates of derivatives.
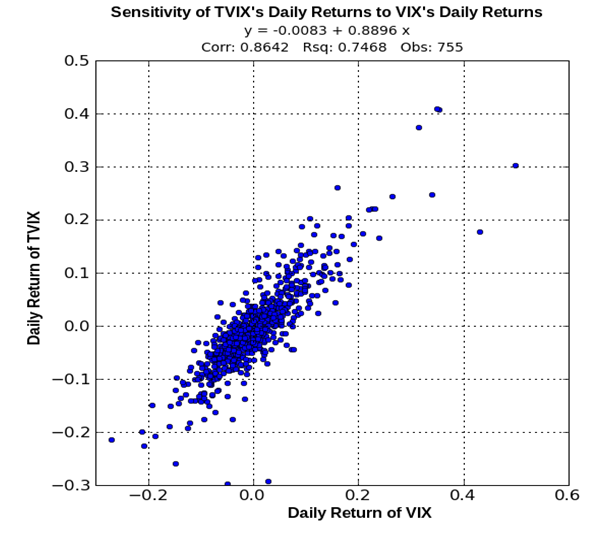
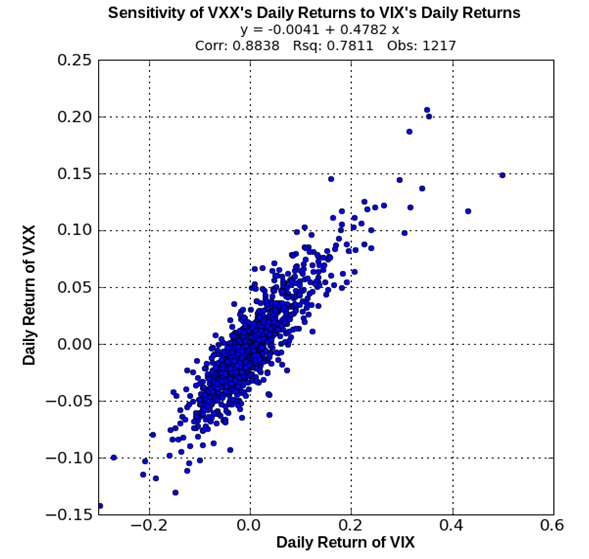
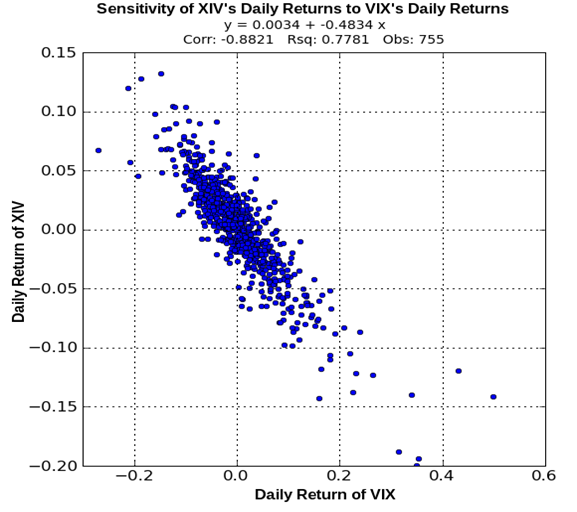
The price sensitivity of these funds to the volatility index is best explored by regressing the daily returns of each fund on the daily returns of the volatility index it targets. The images below show the regression results using the daily closing prices since 2006. These results suggest that the daily returns of ETFs are strongly correlated with those of the volatility indexes. The slope coefficient expresses the sensitivity of the fund's daily return to the Volatility Index's daily return.
Owning a volatility-targeting fund is equivalent to owning a portfolio whose value is sensitive to the volatility of a targeted underlying index. The fund's sensitivity to the volatility index can be translated to the Vega of the underlying as follows.
Vega(Underlying)
= (Sensitivity of the fund's return to Volatility Index return) x (Current Fund price / Current Volatility Index) x (Volatility Index-specific scaling factor) x 0.01
= (Sensitivity of the fund's price movement to Volatility Index price movement) x (Volatility Index-specific scaling factor) x 0.01
While the “Sensitivity of the fund's price movement to Volatility Index price movement” was estimated from historical prices, some users may express a different view than historical data would suggest. We provide the flexibility for them to specify their own override on the “Sensitivity Editor”.
Three portfolio value curves are displayed on the Equity/Commodity tab:
A) at the current volatility
B) if the volatility is increased by 15%
C) if the volatility is decreased by 15%
The portfolio value difference on the Equity/Commodity tab between A and B on the Equity/Commodity tab is equal to the portfolio value difference on the Volatility Products tab between the current level and the 15%-up level of the volatility index. A similar description applies to the portfolio value curve C.
Volatility products are aggregated by the volatility indexes that they are sensitive to. For example, VXX, XIV, and VIX options are sensitive to VIX. There is a drop-down list showing all the volatility indexes that volatility products within the portfolio are sensitive to. When the user selects a particular volatility index, Risk Navigator will aggregate the price scans of only those volatility products that are sensitive to this volatility index, and ignore the rest. When the entire portfolio is sensitive to only one volatility index, that index is selected by default.