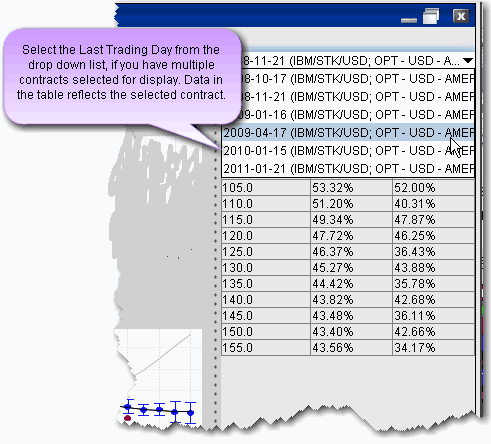
The volatility curve table reflects the data in the plot. To add IV (Manual) entries, use the Edit menu to select the profile to edit, or right-click in a plot and select Edit. Both the volatility plot and table become editable. In the Manual column, double-click the implied volatility at a strike price and enter a new value.

By default, the Model Navigator’s sophisticated option model calculation engine uses the values in the plot along with the calculated interest rate, dividends, underlying price and other parameters, to calculate the Model price. If you prefer to calculate the model price using the pricing assumptions reflected in an edited plot, you must apply the changes to your plot and leave it in Edit mode. Any expiry that has a volatility curve plot in Edit mode will use this profile in the calculation of the Model price and Implied Volatility.
You can also modify the Interest Rates and Dividend Schedule, and specify that these modified pricing assumptions be used in the Model Price calculations.