The Accumulation Swing Index is a cumulative total of the Swing Index and attempts to show the phantom line which represents the “real market,” which theoretically occurs among the open, high, low and close prices. Since the Accumulation Swing Index attempts to show the "real market," it closely resembles the prices themselves. This allows you to use classic support/resistance analysis on the Index itself.
Typical analysis involves looking for breakouts, new highs and lows, and divergences.
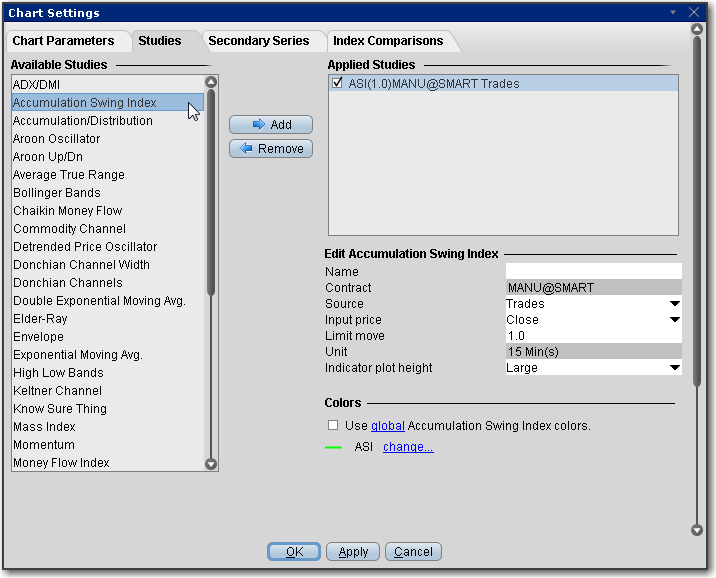
To apply an Accumulation Swing Index Indicator
Once the study is defined, you can elect to uncheck/check to remove and add the study to your chart.