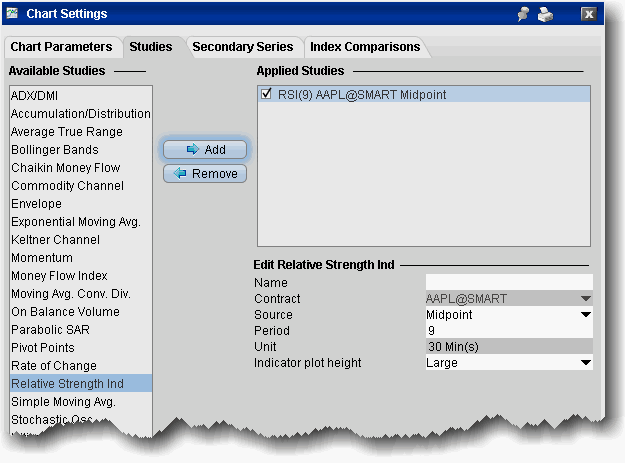
The RSI indicator is for overbought/oversold conditions. It goes up when the market is strong, and down when the market is weak, and oscillates between 0 -100. The RSI calculation is:
RSI = 100-(100/1+RS)
Where:
RS - Average of X bars Up Closes/Average X bars Down Closes (X=number of bars set by user)

To apply a Relative Strength Indicator