Open topic with navigation
Apply a Williams Oscillator Indicator
The Williams Percent Range (%R) indicator identifies the overbought/oversold levels. The scale extends from 0 to -100.
%R = (HIGH(i-n)-CLOSE)/(HIGH(i-n)-LOW(i-n))-100
Where:
- CLOSE — is today’s closing price.
- HIGH(i-n) — is the highest high over a number (n) of previous periods.
- LOW(i-n) — is the lowest low over a number (n) of previous periods.
To apply a Williams Oscillator indicator
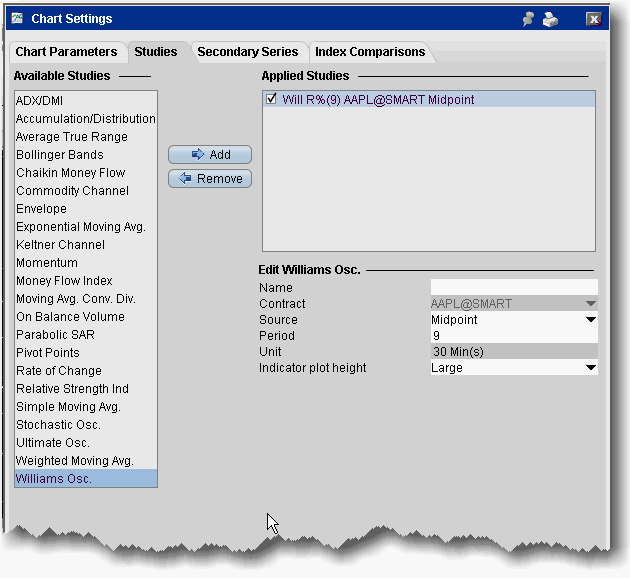
- From within a chart, from the Edit menu select Studies.
- Choose Williams Osc. and Add the study.
- Complete parameters as necessary.

