Open topic with navigation
Apply ADX/DMI Indicator
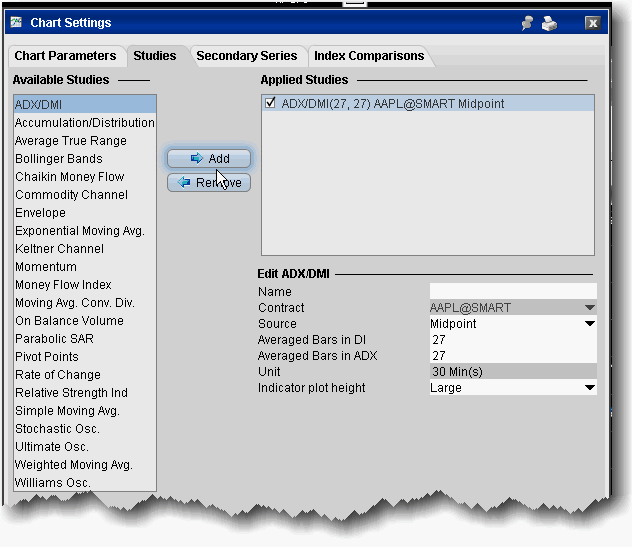
To apply an ADX/DMI Indicator
- From within a chart, from the Edit menu select Studies.
- Choose ADX/DMI and Add the study.
- Complete parameters as necessary.
The ADX/DMI is represented by three lines +DM, -DM and ADX.
The Directional movement
If today's High is higher than yesterday's High then:
+DM = today's High - yesterday's High
If today's Low is lower than yesterday's Low then:
-DM = yesterday's Low - today's Low
If +DM is greater than -DM then: -DM = 0
If +DM is less than -DM then: +DM = 0
The true range
True range is the largest of:
- |today's High - today's Low|
- |today's High - yesterday's Close|
- |yesterday's Close - today's Low|
Moving average of +DM, -DM and True Range
- +DMMA = exponential moving average of +DM
- -DMMA = exponential moving average of -DM
- TRMA = exponential moving average of True Range
The Directional Indicators
- +DI = +DMMA / TRMA
- -DI = -DMMA / TRMA
Directional Index
- DX = |(+DI - (-DI))| / (+DI + (-DI))
The Average Directional Movement Index
- ADX = the exponential moving average of DX
- ADX = SUM[(+DI-(-DI))/(+DI+(-DI)), N]/N
Where:
N — the number of periods used in the calculation.