Bollinger Bands measure volatility by plotting a series of three bands. The middle band represents the moving average (SMA or WMA or EMA). The upper band is a set number of standard deviations higher than the middle band (generally 2), and the lower band is a set number of standard deviations (generally 2) lower than the middle band. You set the distance of standard deviation when you create the study.
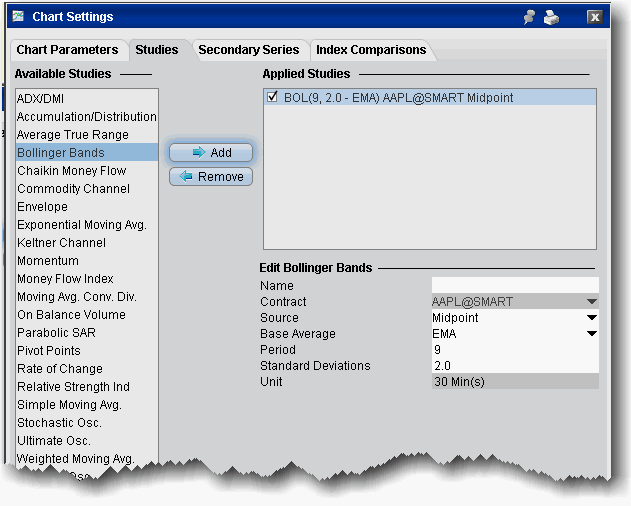
To apply Bollinger Bands
Complete parameters as necessary.
Bollinger Bands are calculated like this:
TL = ML + (D*StdDev)
BL = ML — (D*StdDev)
Where:
ML - middle line
Avg(N) - SMA or WMA or EMA
TL - top line
BL - bottom line
N — is the number of periods used in calculation;
StdDev — the Standard Deviation.
StdDev = SQRT(SUM[(CLOSE — SMA(CLOSE, N))^2, N]/N)