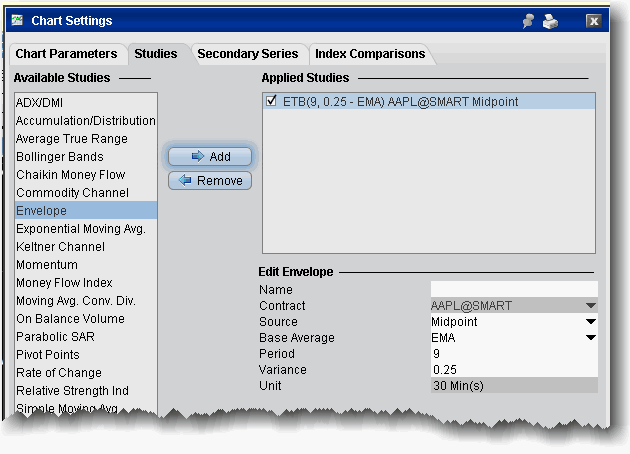
SMA/WMA/EMA Envelopes plot a band composed of two moving averages, one which is shifting upwards, the other shifting downwards, to help define a stock's upper and lower boundaries. The bands of an envelope are calculated as follows:
Upper Band = MA(CLOSE, N)*[1+K/100]
Lower Band = MA(CLOSE, N)*[1-K/100]
Where:
MA — Simple (or Weighted or Exponential) Moving Average;
N — averaging period;
K/100 — the value of shifting from the average (measured in basis points).

To apply an Envelope indicator