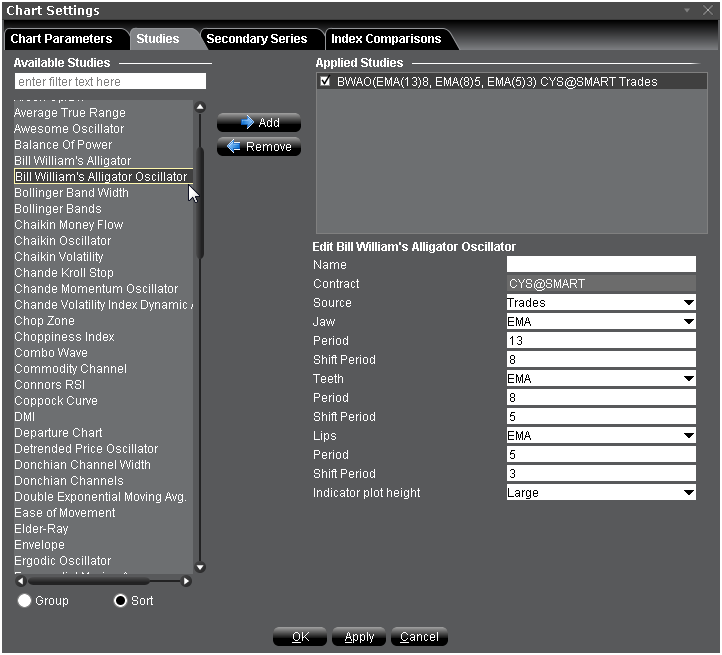
This indicator is displayed as a line chart in a plot separate from the Alligator. The Alligator Oscillator includes the same configurable fields as the Alligator plus a field to adjust the plot height of the indicator.
To apply a Bill Williams Alligator Oscillator
Once the study is defined, you can elect to uncheck/check to remove and add the study to your chart.