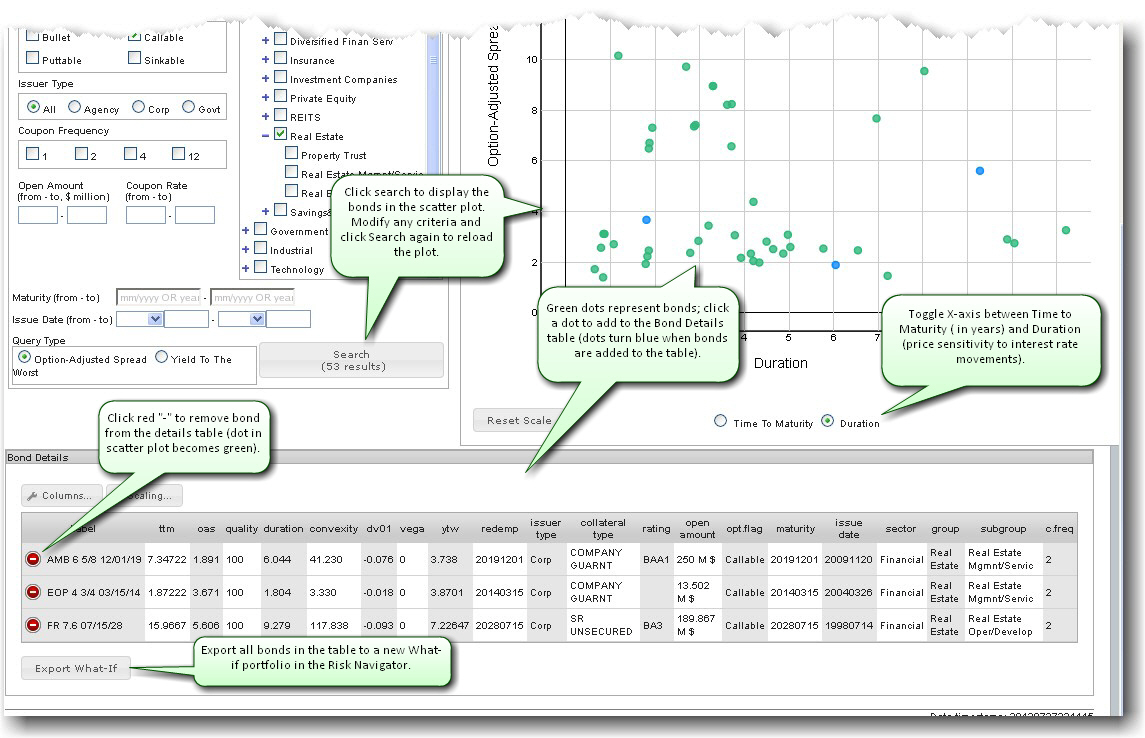
The results of a bond search are presented in a scatter plot, where each green dot represents a bond that meets the specified criteria.
To display a scatter plot
To zoom in, click in the plot and drag. The area to be enlarged is appears highlighted in yellow. To unzoom, click Reset Scale.
By default, the X-axis displays maturity in years. For an Option Adjusted Spread, the scatter plot can be toggled between Time to Maturity (in years) and Duration (price sensitivity to interest rate movements).
The Y-axis represents the query type: Option-Adjusted Spread (to evaluate bond price) or Yield to the Worst (lowest potential yield on a bond). The higher the YTW – the more risk.