The Chaikin Oscillator monitors the flow of money in and out of the market. It calculates and plots the difference between the 10-period exponential moving average and the three-period exponential moving average of the accumulation distribution. The accumulation distribution uses the relationship between the open and the close of the bar and the range of the bar to weigh and characterize the volume as accumulation (buying) or distribution (selling).
In short, the Chaikin Oscillator compares the money flow to the price action of an issue, which allows the user to recognize tops and bottoms in short cycles.
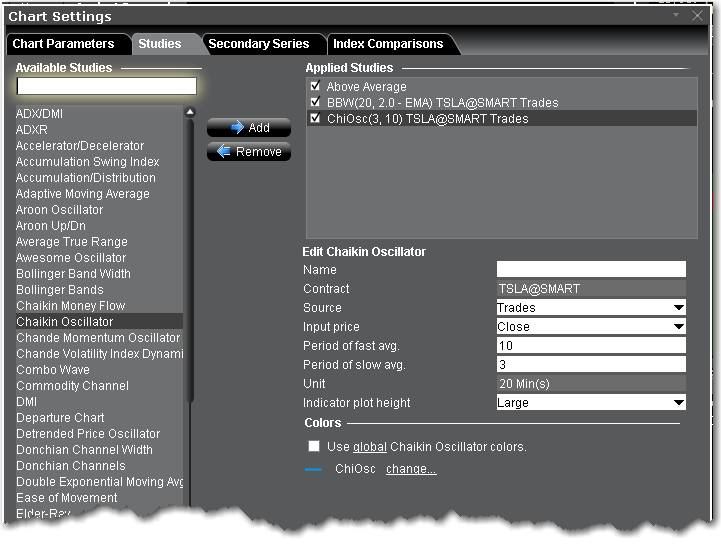
To apply a Chaiken Oscillator Indicator
Once the study is defined, you can elect to uncheck/check to remove and add the study to your chart.