This is a trend-following indicator that identifies the stop loss for a long or short position by using a variation on directional movement. It is calculated on the average true range of an instrument’s volatility. The stops are placed under (and on) the high (low) of the last “n” bars. The difference is proportional to the average True Range on “N” bars.
You can use the Chande Kroll to trade in a number of ways:
As the price moves sideways you will note that the lines begin to flatten out and the price will trade broadly between the two lines. Make sure that when you trade it is always in the direction of the trend.
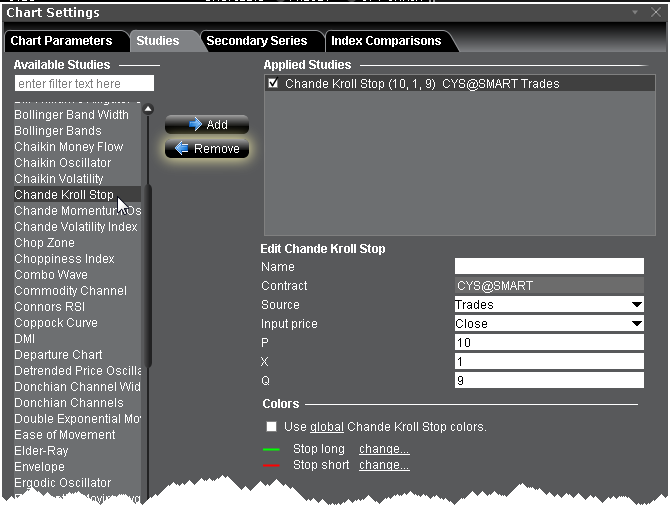
To apply a Chande Kroll Stop Indicator