You can chart two or more assets on the same chart for comparison.
To chart multiple assets
- Trades shows the prices at which orders executed.
- Midpoint plots the midpoint of the current best bid/ask price.
- Bid/Ask shows the best bid and best ask.
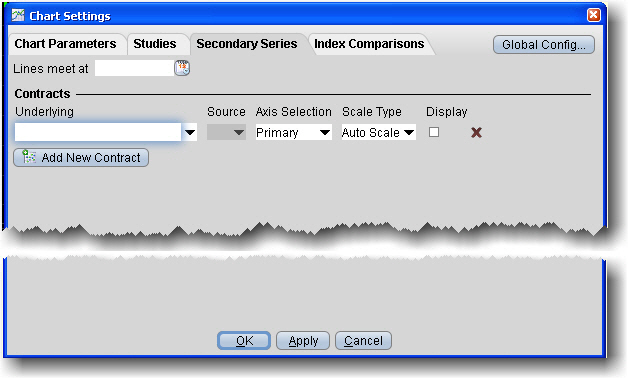
- Primary with Auto Scale automatically scales and plots the secondary contract relative to the price for the primary contract.
- Primary with None does not scale the secondary contract and modifies the price axis to include the price range for both contracts.
- Secondary with Auto Scale automatically scales and plots the secondary contract and shows the scaled, secondary price axis along the right side of the plot.
- Secondary with None shows the secondary price axis along the right side of the chart and plots the secondary series with no scaling along that secondary price axis.
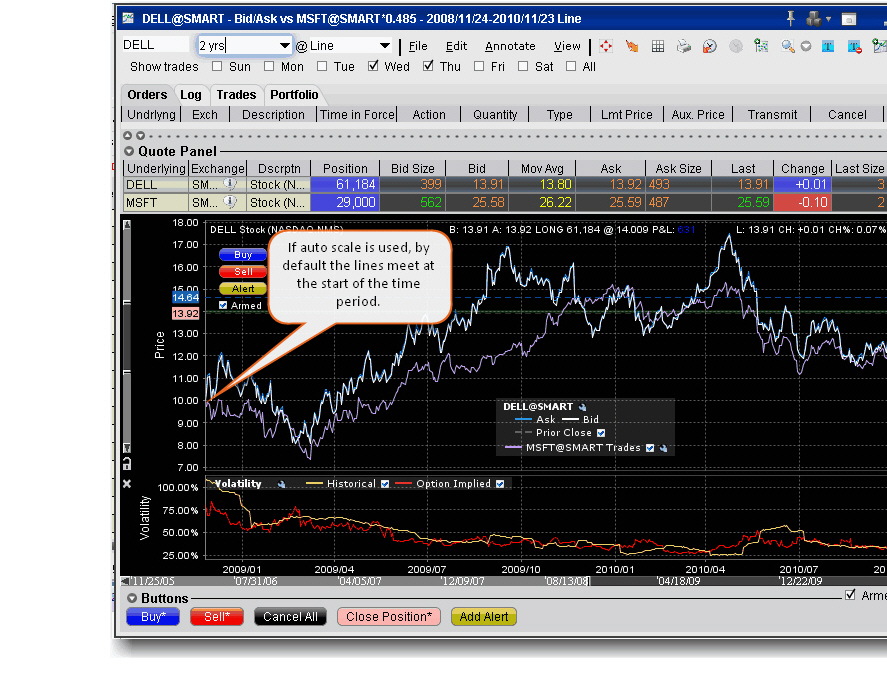
In the Lines meet at: field you can enter a date different from the starting date of the time period at which the two points in the chart will meet. By default, lines meet at the starting date of the time period and are auto-scaled accordingly.