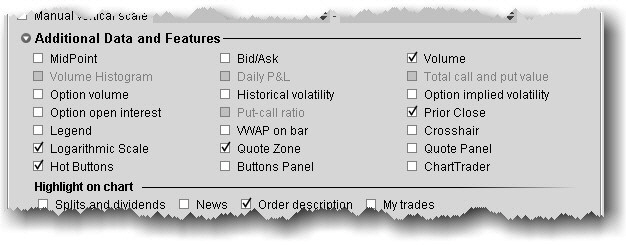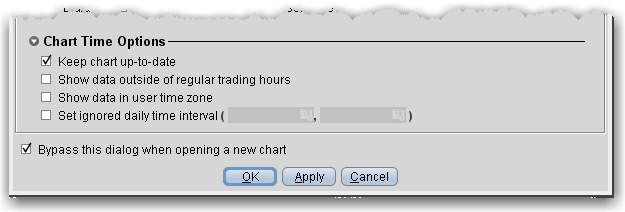
You can set chart parameters when you open a chart, and modify parameters from within a chart using the Edit menu.

Additional data shown in your chart parameters box is dependent on the selections you set as the primary parameters. The table below lists all potential options. Because they are context-sensitive, you won’t see all of them at the same time.

Define the extras you want to have highlighted on your chart.

|
Field |
Description |
|
Splits and dividends |
Shows splits and dividends on the underlying. |
|
Order description |
Includes order information directly in the chart. |
|
My trades |
Highlights the trades you made on the underlying. |
Specify that any of the following items be highlighted along the Y-axis in the chart.

|
Field |
Description |
|
Bid/ask |
Highlights the bid and ask prices. |
|
Last |
Highlights the last traded price. |
|
Highlights the current high and low of the underlying. |
|
|
Cursor price |
Highlights the current price level of your mouse cursor. |
A vertical buffer makes the price range on a chart larger than necessary to give extra space at the top and bottom of the actual chart. When you add a vertical buffer, the chart automatically scales to accommodate a wider price range. You can elect to:

|
Field |
Description |
|
Scale to Fit Studies |
Y-axis (price) scaling will accommodate any studies to ensure that they are visible in the new scaled layout. |
|
Ignore Studies |
Y-axis (price) scaling ignores any studies and applies scaling only based on price. |
|
Display Vertical Scrollbar |
Checked by default. Uncheck to removed the vertical scrollbar from the scaled chart. |
Set time options for this chart.
