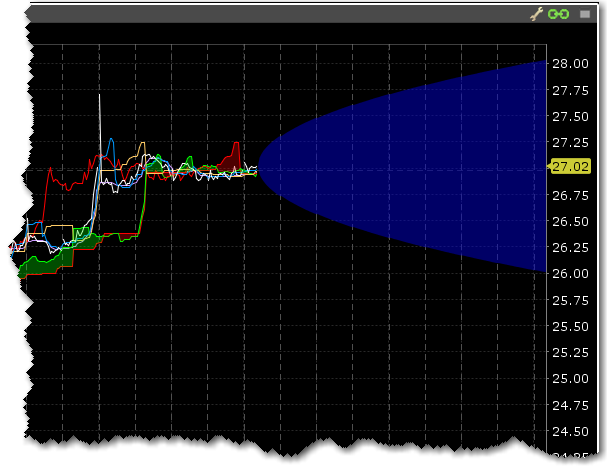
The Estimated Price Range presents a graphical representation of the estimated price range of an asset to one, two or three standard deviations. The estimated range is calculated based on the current price, the implied volatility of the symbol's option, and the distance in time from "now." The graphical representation uses a blue shaded area to chart the estimated range over time.
Note: This feature is only available for contracts that have options.
To display the Estimated Price Range
1. Ensure that the feature is activated in the Chart Parameters box.
2. Grab the right margin arrow to the left to expose the blue Estimated Price Range graphic.
Slide the margin line to the left or right to see the estimated price range for specific days.
To enable Estimated Price Range
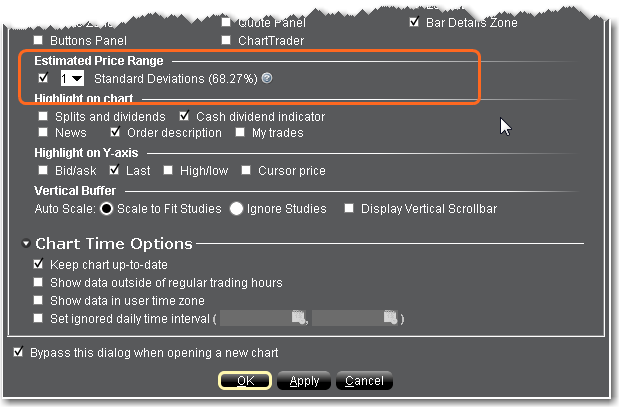
1. Open the Chart Parameters box (from Mosaic use the File menu; from TWS use the Edit menu).
2. Check Estimated Price Range and specify the number of standard deviations.
3. Click OK.