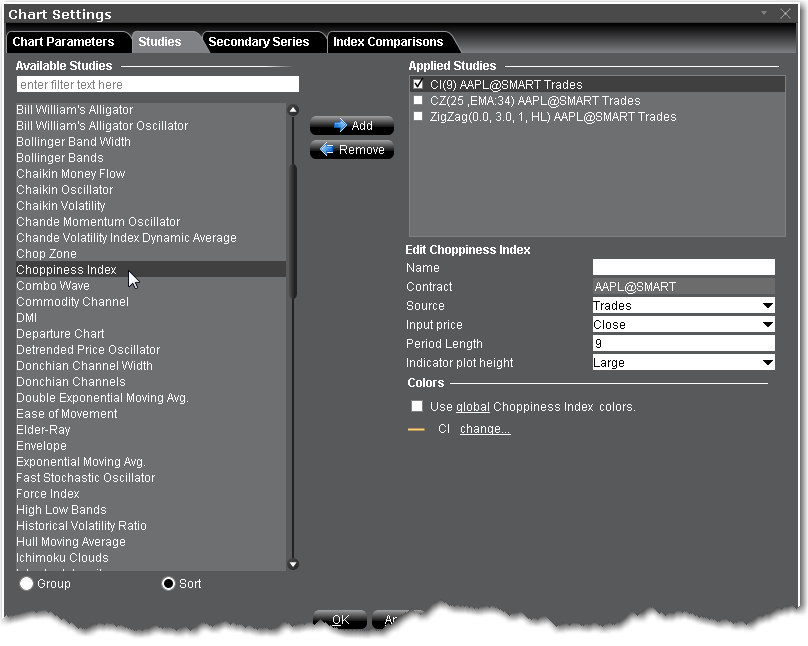
The Choppiness Index is designed to determine whether the market is choppy or trading sideways, or not choppy and trading within a trend in either direction. Using a scale from 1 - 100, the market is considered to be choppy as values near 100 (over 61.80) and trending when values are lower than 38.20).

To apply a Choppiness Index Indicator
Once the study is defined, you can elect to uncheck/check to remove and add the study to your chart.