This is a visual indicator designed to identify trends and choppiness. Plotted within -100/+100 levels, the Chop Zone illustrates the difference between close price and its EMA by converting its values to colors.
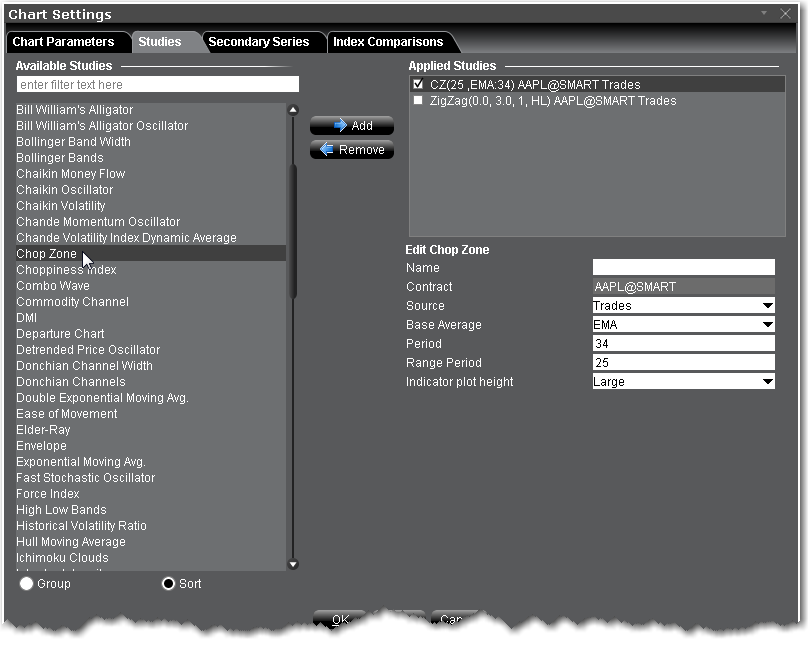
To apply a Chop Zone Indicator
Once the study is defined, you can elect to uncheck/check to remove and add the study to your chart.