A three period RSI, the Connors RSI is a composite indicator consisting of three components. Two use the Relative Strength Index (RSI) calculations, and the third ranks the most recent price change on a scale of 0 to 100. Working together, these three factors form a momentum oscillator, an indicator that fluctuates between 0 and 100 to indicate the level to which a security is overbought (high values) or oversold (low values).
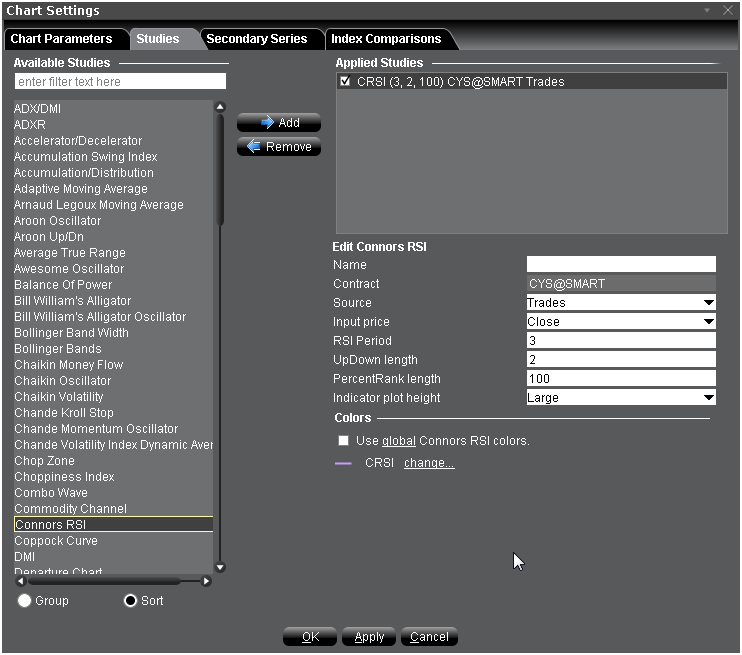
To apply a Connors RSI
Once the study is defined, you can elect to uncheck/check to remove and add the study to your chart.