Open topic with navigation
Create a Line Chart
To create a line chart
- Select the contract for which you want to create a chart, and from the right-click menu select Charts and then New Chart.
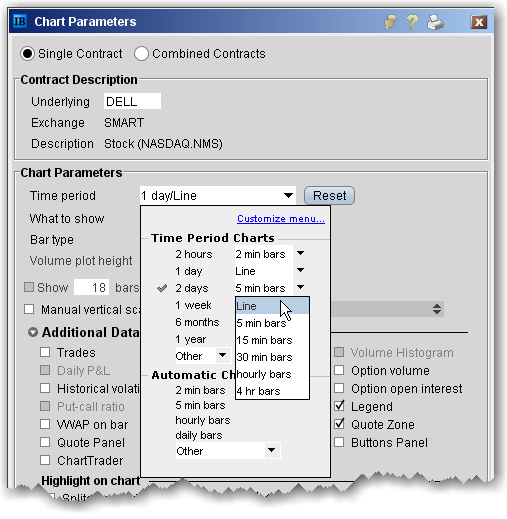
- In the Time Period selector, choose a "line" interval.
- Click OK to view the chart. For details on all of the setting you can use, see the Create a Real-time Chart overview topic.