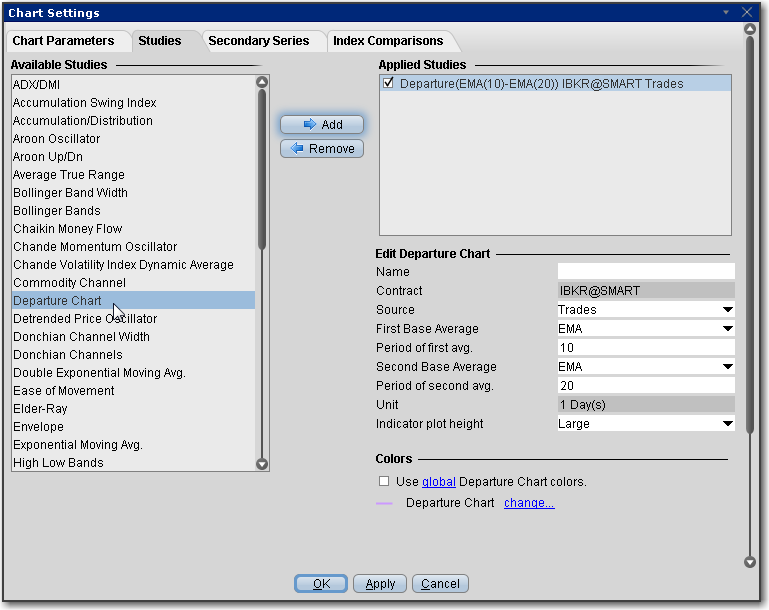
One of the oldest technical studies, the Departure Chart measures the difference between two moving averages of price; one short and one long. Its primary use is as a trend identification tool, but it may also be used to identify overbought and oversold conditions as well. Default periods are 10 and 20.