Measures the amount of buying and selling pressure in the market. This indicator consists of two separate indicators known as "bull power" and "bear power". These can help a trader to determine the position of the price relative to a certain exponential moving average (EMA).
Bull Power = Daily High - n-period EMA Bear Power = Daily Low - n-period EMA
Use the values of the bull and bear power along with divergence to help make transaction decisions. Consider taking a long position when the bear power has a value below zero but is increasing, and the bull power's latest peak is higher than it was previously. Consider a short position when the bull-power value is positive but falling, and the bear power's recent low is lower than any other previous bottom. The slope of the EMA can also be used in both cases to help confirm the direction of the trend.
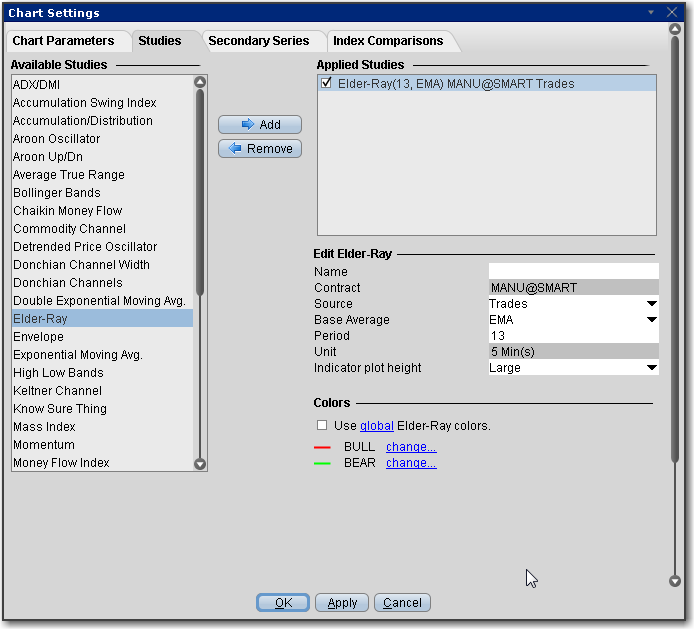
To apply an Elder-Ray Indicator
Once the study is defined, you can elect to uncheck/check to remove and add the study to your chart.