The stochastic oscillator provides information about the location of a current close in relation to the period's high and low. It ranges between 0% and 100%. A reading of 0% indicates that the close was the lowest price at which the security traded during the preceding x number of time periods. A reading of 100% indicates that the close was the highest price at which the security traded during the preceding x number of time periods.
This version of the Stochastic Oscillator does not include the Period of slow average. The fast stochastic may be more sensitive to changes in the price of the underlying than the slow version.
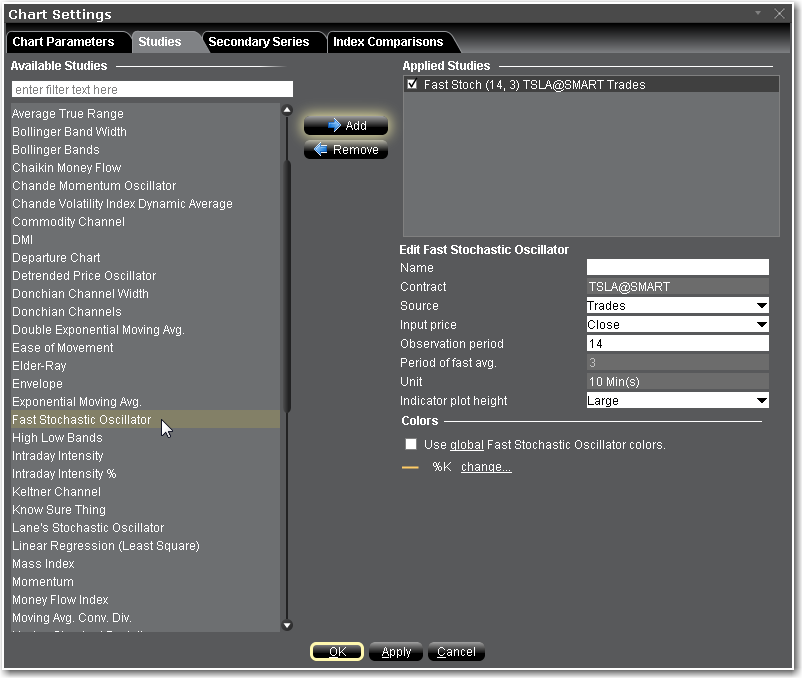
To apply a Fast Stochastic Oscillator
Once the study is defined, you can elect to uncheck/check to remove and add the study to your chart.