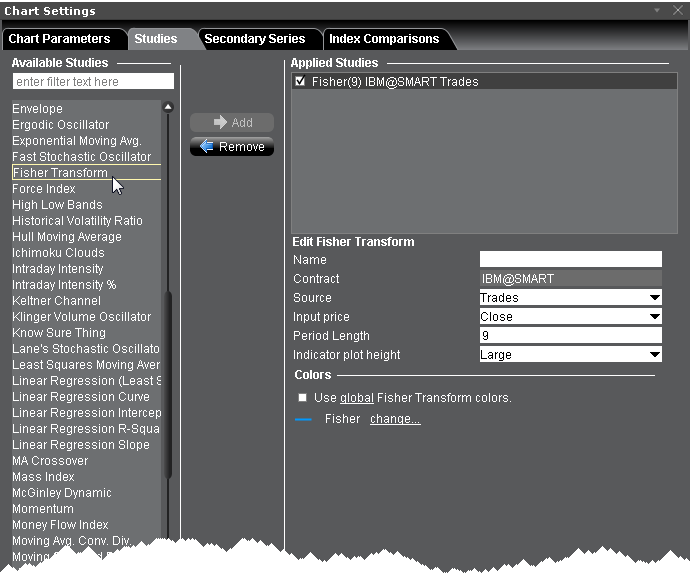
Used to predict price reversals. The Fisher Transform helps to more clearly identify extreme price movements by transforming the probability density function of any waveform to a bell-curve.

To apply a Fisher Transform Indicator
Once the study is defined, you can elect to uncheck/check to remove and add the study to your chart.