These two bands are generated from the triangular moving averages (calculated from the underlying price) and sandwich the underlying price. The triangular moving average is, in turn, shifted up and down by a fixed percentage. The bands are wave-lines formed by shifting the triangular moving average by some specific percentage on both the sides. Triangular moving averages are smooth in nature, which is why High Low bands tend to be more responsive to price fluctuations. They are most effective when it comes to trending markets, and may generate signals in trending markets. These bands, similar to all other indicators, fail in sideways or choppy markets.
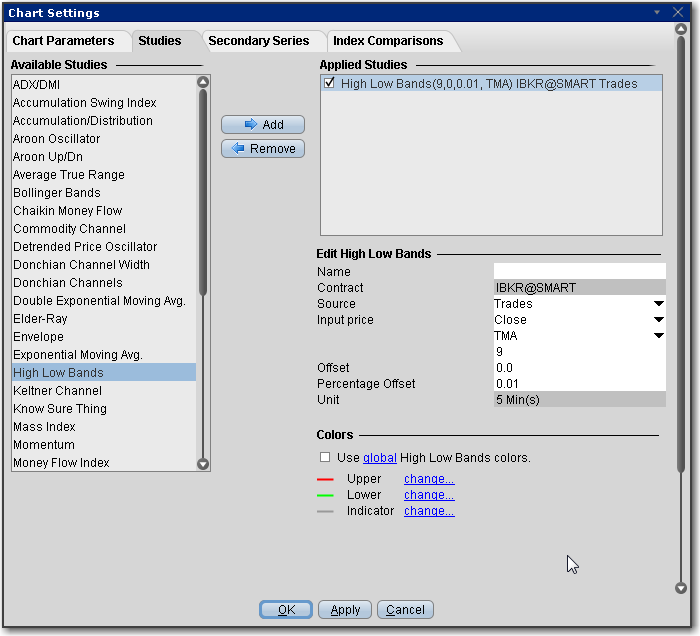
To apply High/Low Bands
Once the study is defined, you can elect to uncheck/check to remove and add the study to your chart.