The Historical Volatility Ratio is the percentage of short to long average historical volatility. When a market's short volatility declines below a certain percentage of its long volatility, it may be an indication that an explosive move is imminent
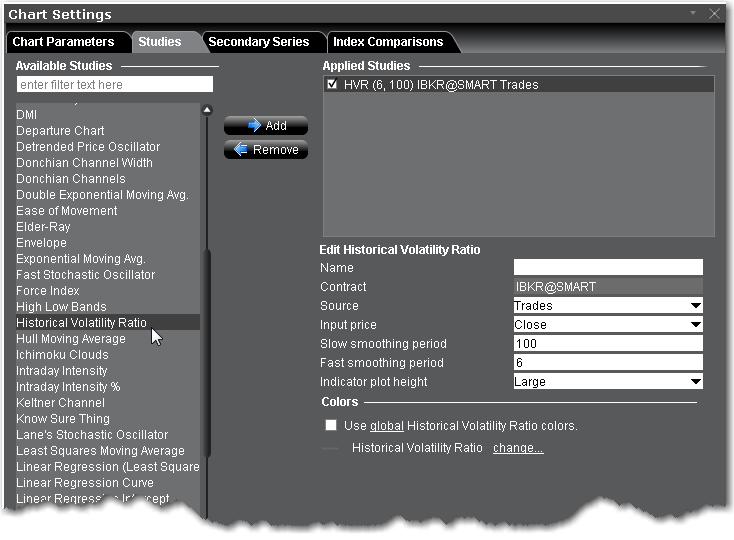
To apply a Historical Volatility Ratio Indicator
Once the study is defined, you can elect to uncheck/check to remove and add the study to your chart.