The Ichimoku Cloud indicator shows support and resistance, and momentum and trend directions. The "cloud" comprises five lines, and is formed between the spans of the conversion and baseline moving averages and the midpoint of the 52-week high and low.
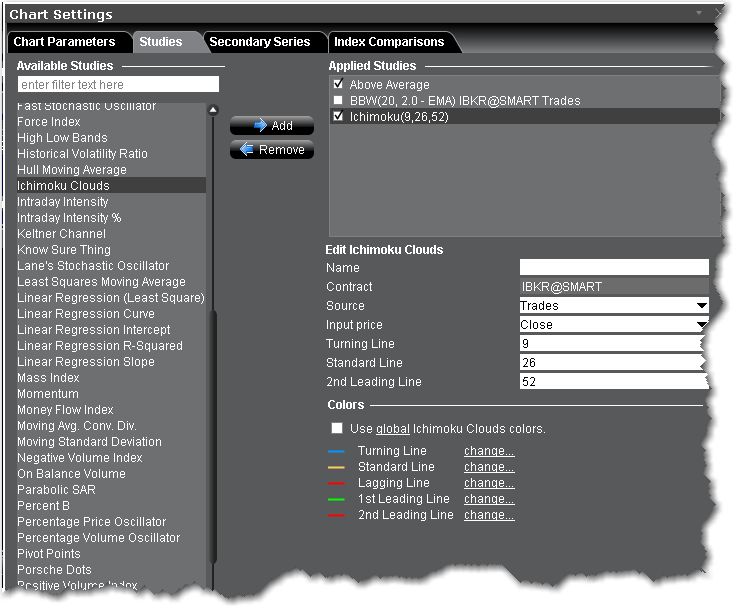
To apply an Ichimoku Cloud Indicator
Once the study is defined, you can elect to uncheck/check to remove and add the study to your chart.