A technical indicator that approximates the volume of trading for a specified security in a given day. It is designed to help track the activity of institutional block traders and is calculated by subtracting the day's high and low from double the closing price, divided by the volume and multiplied by the difference between the high and the low.
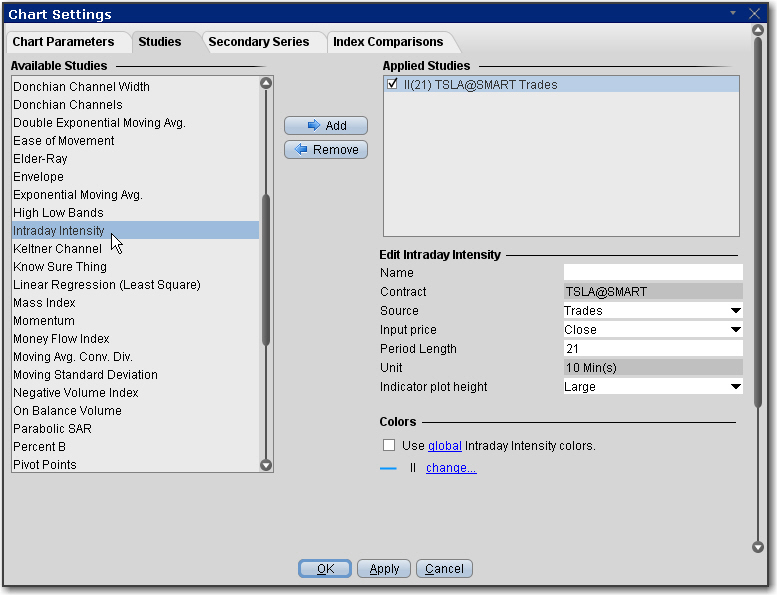
To apply an Intraday Intensity Index Indicator
Once the study is defined, you can elect to uncheck/check to remove and add the study to your chart.