The stochastic oscillator provides information about the location of a current close in relation to the period's high and low. It ranges between 0% and 100%. A reading of 0% indicates that the close was the lowest price at which the security traded during the preceding x number of time periods. A reading of 100% indicates that the close was the highest price at which the security traded during the preceding x number of time periods.
Like the full Stochastic Oscillator, you can edit the source, input price and observation period, but the periods of fast and slow average cannot be edited and the method used is always SMA. use the full Stochastic Oscillator for more flexibility.
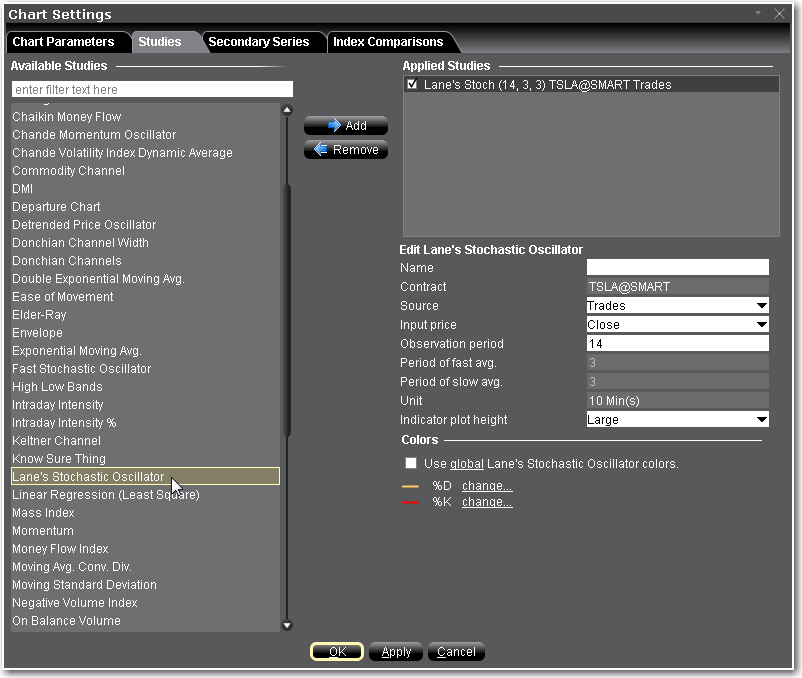
To apply a Lane's Stochastic Oscillator
Once the study is defined, you can elect to uncheck/check to remove and add the study to your chart.