Sometimes called an End Point Moving Average, this indicator is based on a linear regression, but goes one step further by estimating what would happen if the regression line continued. Least Squares Moving Average is used mainly as a crossover signal with another moving average or with itself.
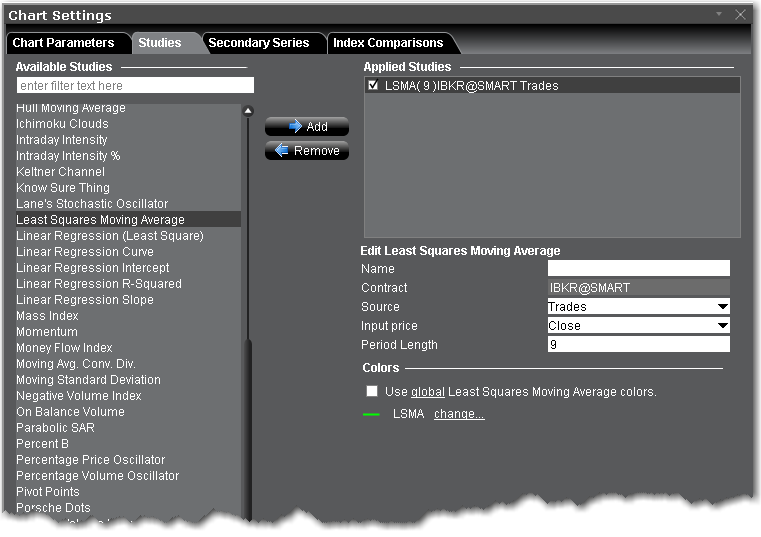
To apply a Least Squares Moving Average Indicator
Once the study is defined, you can elect to uncheck/check to remove and add the study to your chart.