This indicator plots a line that best fits the prices specified over a user-defined time period. The Linear Regression Curve is used mainly to identify trend direction and is sometimes used to generate buy and sell signals.
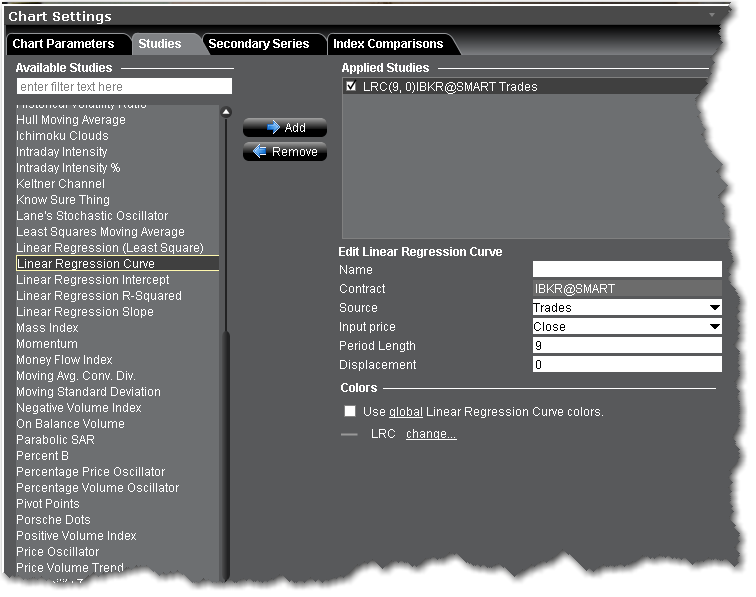
To apply a Linear Regression Curve Indicator
Once the study is defined, you can elect to uncheck/check to remove and add the study to your chart.