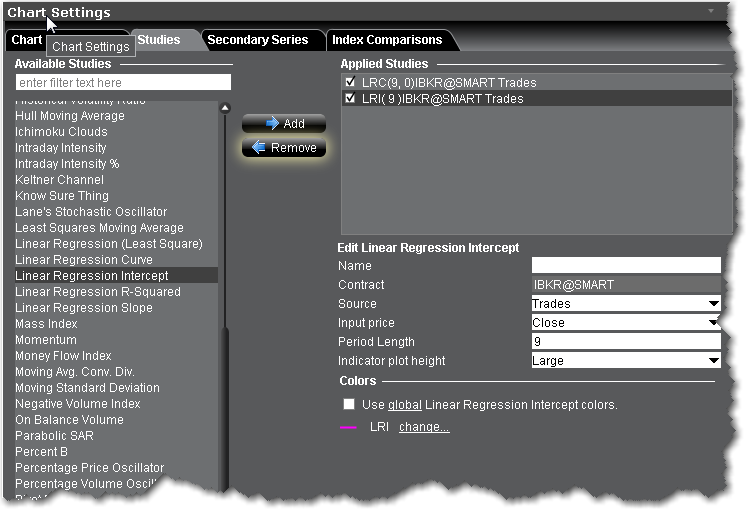
A statistical tool used to help predict future values from past values. It is commonly used as a quantitative way to determine the underlying trend and when prices are overextended.
To apply a Linear Regression Intercept Indicator
Once the study is defined, you can elect to uncheck/check to remove and add the study to your chart.