A common statistical technique used to identify the strength and direction of a dominant market trend. The Linear Regression Slope is a centered oscillator type of indicator similar to momentum indicators. As indicated by its name, it "oscillates" or fluctuates above and below a central line drawn at 0. In general, the momentum is positive when the slope is above 0 and negative when it is below 0. It can be used to measure the strength or weakness and direction of the momentum.
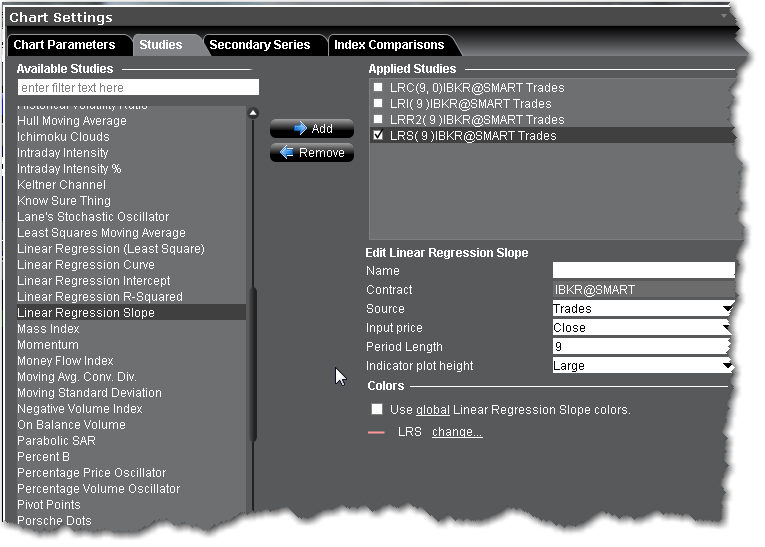
To apply a Linear Regression Slope Indicator
Once the study is defined, you can elect to uncheck/check to remove and add the study to your chart.