An indicator used to determine the strength of the dominant market trend. It is typically used with other indicators such as Linear Regression Slope. The Slope indicates the overall market trend (positive or negative) and the R-Squared indicates the strength.
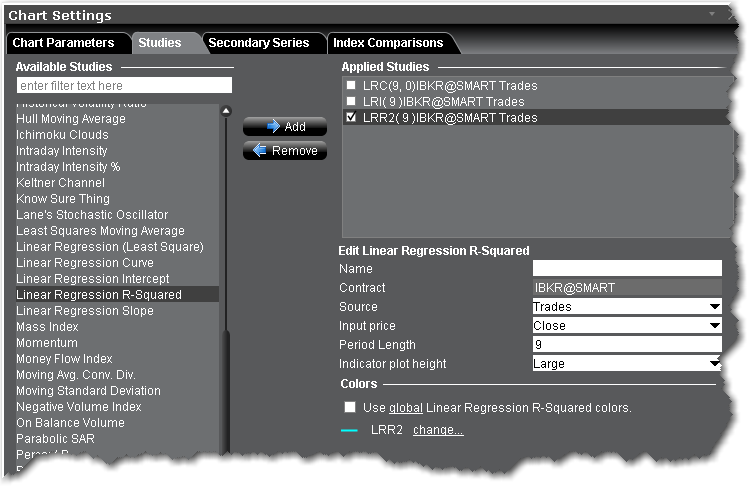
To apply a Linear Regression R-Squared Indicator
Once the study is defined, you can elect to uncheck/check to remove and add the study to your chart.