This indicator examines the range between high and low stock prices over a specific period of time. It suggests that a reversal of the current trend will likely take place when the range widens beyond a certain point and then contracts.
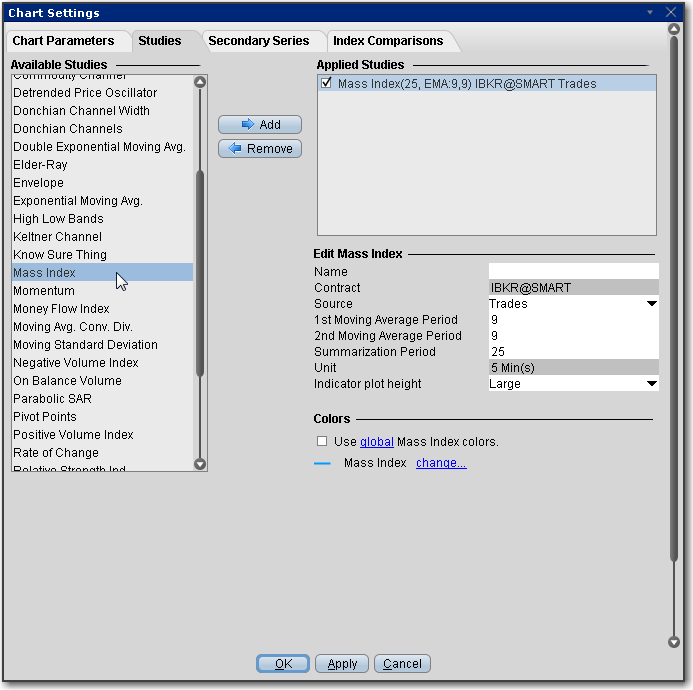
To apply a Mass Index Indicator
Once the study is defined, you can elect to uncheck/check to remove and add the study to your chart.