The McGinley Dynamic is a smoothing mechanism for prices that often tracks far better than any moving average. It minimizes price separation and price whipsaws and hugs prices much more closely. Because of the calculation, the Dynamic Line speeds up in down markets as it follows prices yet moves more slowly in up markets.
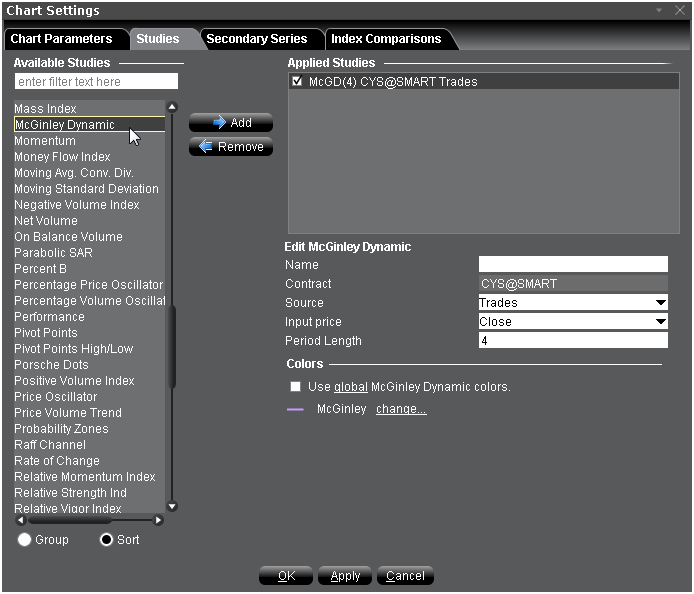
To apply a McGinley Dynamic Indicator
Once the study is defined, you can elect to uncheck/check to remove and add the study to your chart.