Standard deviation is a statistical term that provides a good indication of volatility. It measures how widely values (for example, closing prices) are dispersed from the average. Dispersion is the difference between the actual value (closing price) and the average value (mean closing price). The larger the difference between the closing prices and the average price, the higher the standard deviation will be and the higher the volatility. The nearer the closing prices are to the average price, the lower the standard deviation and the lower the volatility.

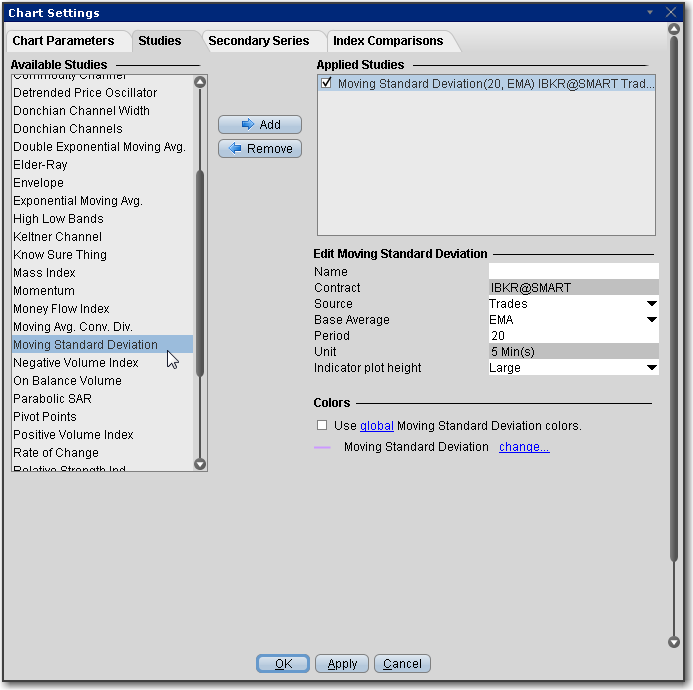
To apply a Moving Standard Deviation Indicator
Once the study is defined, you can elect to uncheck/check to remove and add the study to your chart.