This indicator relies on changes in a security’s volume to identify when so-called “smart money” (i.e. institutions, funds and professional traders) is driving the current trend. The Negative Volume Index suggests that unsophisticated investors buy and sell primarily on high-volume days, while shrewd investors are more likely to trade on low-volume days. Often when volume drops, price drops. If a stock’s price increases despite a decrease in volume, technical analysts consider this a positive sign. They use the negative volume index to help identify bull and bear markets.
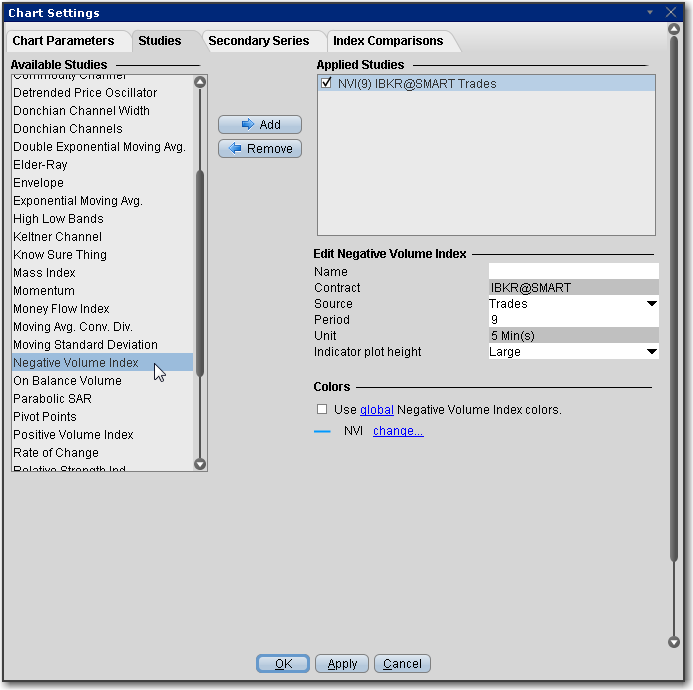
To apply a Negative Volume Index Indicator
Once the study is defined, you can elect to uncheck/check to remove and add the study to your chart.