A security's uptick volume minus its downtick volume over a specified time period. The net volume of a stock aggregates the total positive and negative movements of the security over this period. When the total upward movement is greater than the total downward movement over this period, the stock has a positive net volume.
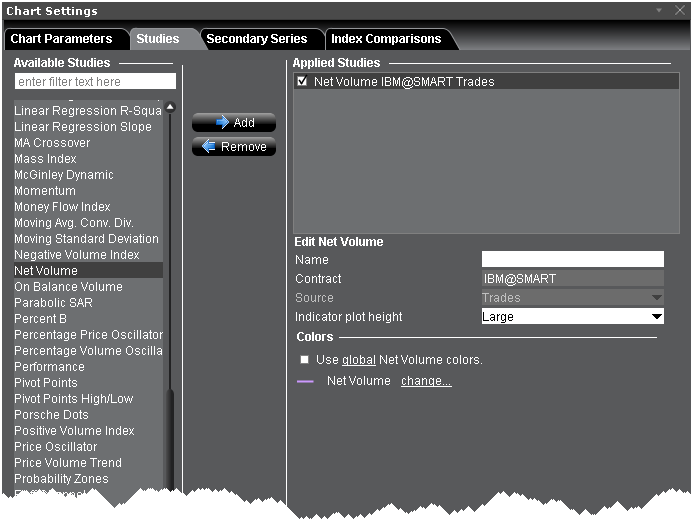
To apply a Net Volume Indicator
Once the study is defined, you can elect to uncheck/check to remove and add the study to your chart.