The Performance indicator displays a security's price performance as a percentage. This is sometimes called a "normalized" chart. The Performance indicator displays the percentage that the security has increased since the first period displayed. For example, if the Performance indicator is 10, it means that the security's price has increased 10% since the first period displayed on the left side of the chart. Similarly, a value of -10% means that the security's price has fallen by 10% since the first period displayed. Performance charts are helpful for comparing the price movements of different securities.
To apply a Performance Indicator
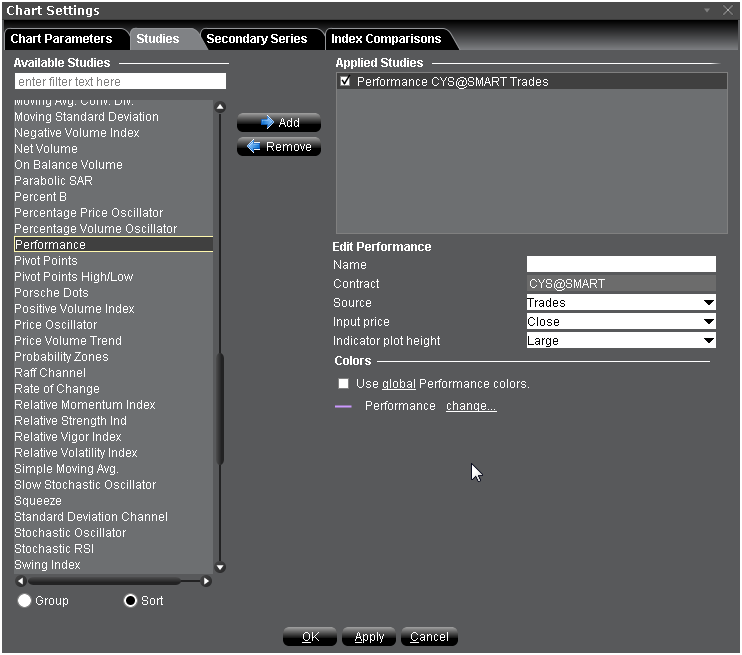
Once the study is defined, you can elect to uncheck/check to remove and add the study to your chart.