You are here: Technical Analytics > Chart Indicators > Pivot Points High Low

Pivot Points High/Low

Pivot points are used to project potential support and resistance levels. Main time periods are daily, weekly and monthly.

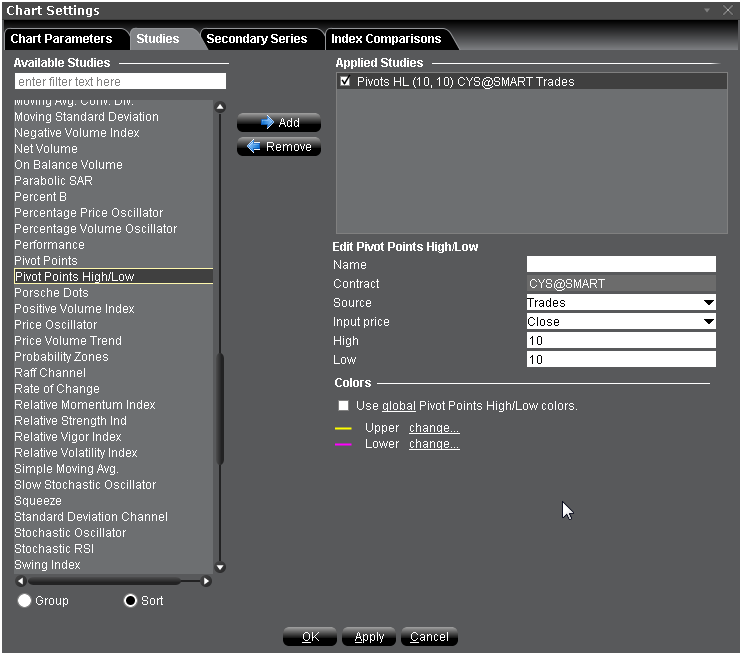
To apply a Pivot Points High/Low Indicator

  1. From within a chart, from the Edit menu select Studies.
  2. Choose Pivot Points High/Low and click Add to add the study to the Applied Studies group.
  3. Complete parameters as necessary.

Once the study is defined, you can elect to uncheck/check to remove and add the study to your chart.