An indicator used in technical analysis that is based on days where trading volume has significantly increased from the previous day. The Positive Volume Index (PVI) assumes that uninformed investors dominate the action on days with substantial trading volume, while the "smart money" - consisting of institutions, funds and professional traders - is more active on relatively quiet days with below-average trading volume.
As the PVI only takes into consideration days when trading volume is higher compared with the previous period, if the PVI is up, it implies that price is appreciating on rising volume, while a lower PVI implies that price is declining on rising volume.
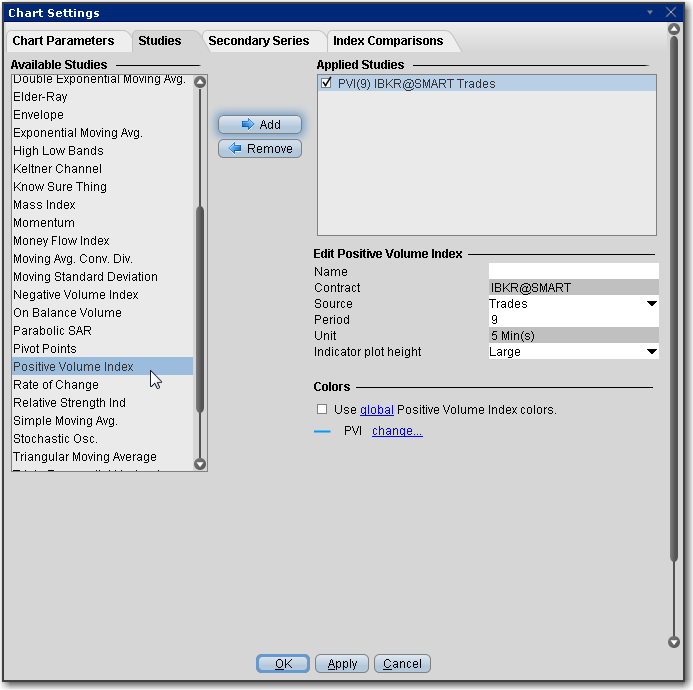
To apply a Positive Volume Index Indicator
Once the study is defined, you can elect to uncheck/check to remove and add the study to your chart.